We recently introduced an expanded time range option to the 30-Year Financial page, allowing users to view more historical data. The time range option is located above the financial table, as the image for Apple Inc. (AAPL) shows.
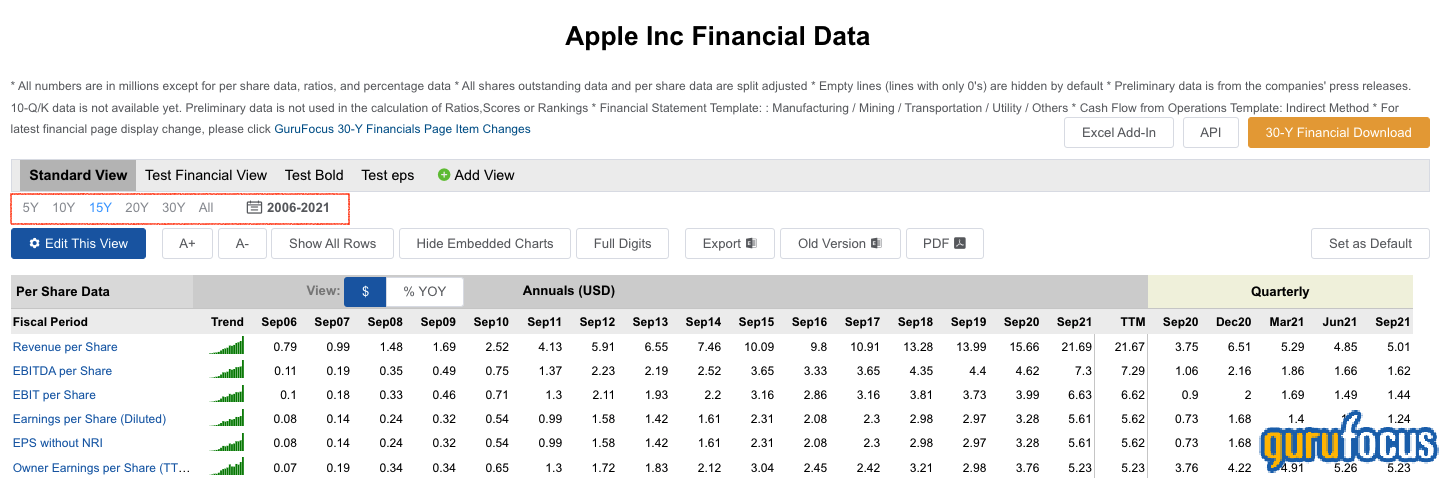
By selecting the year shortcut buttons, which include “5Y”, “10Y”, “15Y, “20Y”, “30Y” and “All,” you will be able to view data within the respective year range. For example, if you select “30Y,” the most recent 30 years of financial data will be displayed.

To select a more specific time range, users can click the calendar button to the right of the “All” option. Then a range of years will pop up. After selecting the start year and end year, click the “Apply Change” button to view the financial data for that period.

In addition, we made some improvements to the charts displayed under each row of financial data. Click on any row to see the related charts. The time ranges for each chart are now synchronized.

For more information on the 30-year financial page, please go here.