

Barclays has commenced coverage of Macy's (M, Financial), assigning it an Equal Weight rating and setting a price target of $12. The analyst notes that Macy's "Bold New Chapter" strategy is designed to revitalize the company's growth trajectory, but remains wary of the persistent challenges facing the department store sector.
The evaluation highlights cautious optimism, acknowledging the positive steps Macy's is taking towards growth. However, the analyst emphasizes that the company faces significant challenges, such as a decelerating consumer market and increased costs due to tariffs, which could impact short-term performance.
Wall Street Analysts Forecast
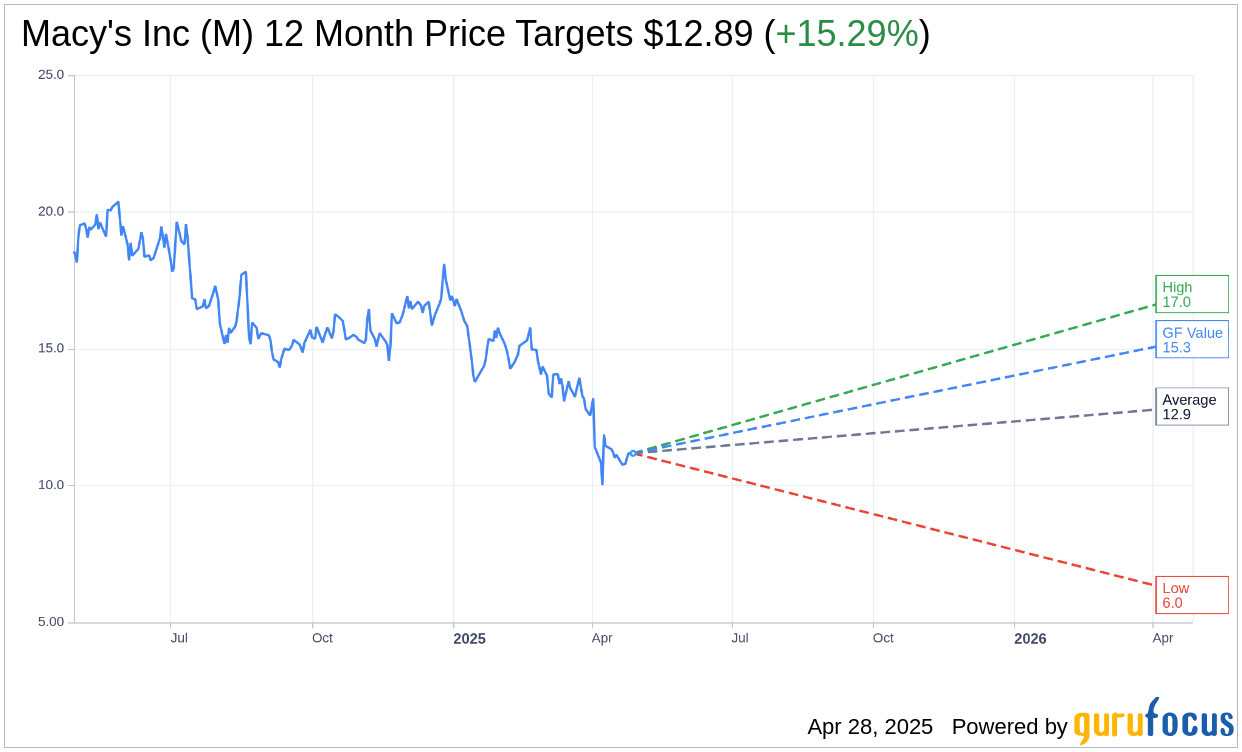
Based on the one-year price targets offered by 9 analysts, the average target price for Macy's Inc (M, Financial) is $12.89 with a high estimate of $17.00 and a low estimate of $6.00. The average target implies an upside of 15.29% from the current price of $11.18. More detailed estimate data can be found on the Macy's Inc (M) Forecast page.
Based on the consensus recommendation from 12 brokerage firms, Macy's Inc's (M, Financial) average brokerage recommendation is currently 2.9, indicating "Hold" status. The rating scale ranges from 1 to 5, where 1 signifies Strong Buy, and 5 denotes Sell.
Based on GuruFocus estimates, the estimated GF Value for Macy's Inc (M, Financial) in one year is $15.35, suggesting a upside of 37.3% from the current price of $11.18. GF Value is GuruFocus' estimate of the fair value that the stock should be traded at. It is calculated based on the historical multiples the stock has traded at previously, as well as past business growth and the future estimates of the business' performance. More detailed data can be found on the Macy's Inc (M) Summary page.
M Key Business Developments
Release Date: March 06, 2025
- Revenue: Fourth quarter net sales were approximately $7.8 billion, compared to $8.1 billion last year.
- Comparable Sales: Total enterprise comps increased by 0.2%, with Macy's Inc. Go-forward comps rising 0.6%.
- Gross Margin: Gross margin rate was 35.7%, 80 basis points below last year.
- Adjusted EPS: Fourth quarter adjusted EPS was $1.80, above the guidance range.
- Free Cash Flow: Generated $679 million of free cash flow, up 71% from last year.
- Store Closures: Closed 64 underperforming Macy's stores, contributing to annual asset sale gains of $144 million.
- Bloomingdale's Performance: Net sales increased by 2%, with comps rising 6.5%.
- Bluemercury Performance: Net sales increased by 2.4%, with comps rising 6.2%.
- Cash on Balance Sheet: Ended the year with $1.3 billion in cash.
- Capital Expenditures: Reduced CapEx by $111 million to $882 million.
- Credit Card Revenues: Net credit card revenues were $175 million, ahead of guidance.
- SG&A Expenses: SG&A expenses were $2.4 billion, 29.7% of total revenue.
- Inventory Levels: Year-end inventories were up 2.5% year-over-year.
For the complete transcript of the earnings call, please refer to the full earnings call transcript.
Positive Points
- Macy's Inc (M, Financial) achieved a 0.2% comp gain in the fourth quarter, marking its highest in 11 quarters.
- The company realized a 71% increase in free cash flow, reaching $679 million, inclusive of asset monetization proceeds.
- Macy's Inc (M) closed 64 underperforming stores, exceeding their annual plan and contributing to asset sale gains.
- Bloomingdale's achieved a positive 6.5% comp, the strongest fourth quarter volume in its history.
- Bluemercury marked its 16th consecutive quarter of positive comps, showcasing strong performance in beauty trends.
Negative Points
- Macy's Inc (M) reported a decline in total net sales to $7.8 billion from $8.1 billion the previous year.
- The company anticipates continued pressure on consumer spending due to inflation and economic uncertainties.
- Macy's Inc (M) expects a decline in comps for 2025, projecting a range of down 2% to down 0.5%.
- The home category remains under pressure, impacted by interest rates and competitive landscape.
- SG&A expenses increased as a percentage of total revenue, reflecting lower year-over-year total revenue.