
Long-established in the Chemicals industry, Dow Inc (DOW, Financial) has enjoyed a stellar reputation. It has recently witnessed a daily gain of 2.45%, juxtaposed with a three-month change of -28.11%. However, fresh insights from the GF Score hint at potential headwinds. Notably, its diminished rankings in financial strength, growth, and valuation suggest that the company might not live up to its historical performance. Join us as we dive deep into these pivotal metrics to unravel the evolving narrative of Dow Inc.

Understanding the GF Score
The GF Score is a stock performance ranking system developed by GuruFocus using five aspects of valuation, which has been found to be closely correlated to the long-term performances of stocks by backtesting from 2006 to 2021. The stocks with a higher GF Score generally generate higher returns than those with a lower GF Score. Therefore, when picking stocks, investors should invest in companies with high GF Scores. The GF Score ranges from 0 to 100, with 100 as the highest rank.
- Financial strength rank: 5/10
- Profitability rank: 6/10
- Growth rank: 4/10
- GF Value rank: 8/10
- Momentum rank: 2/10
Based on the above method, GuruFocus assigned Dow Inc the GF Score of 68 out of 100, which signals poor future outperformance potential.
Company Overview
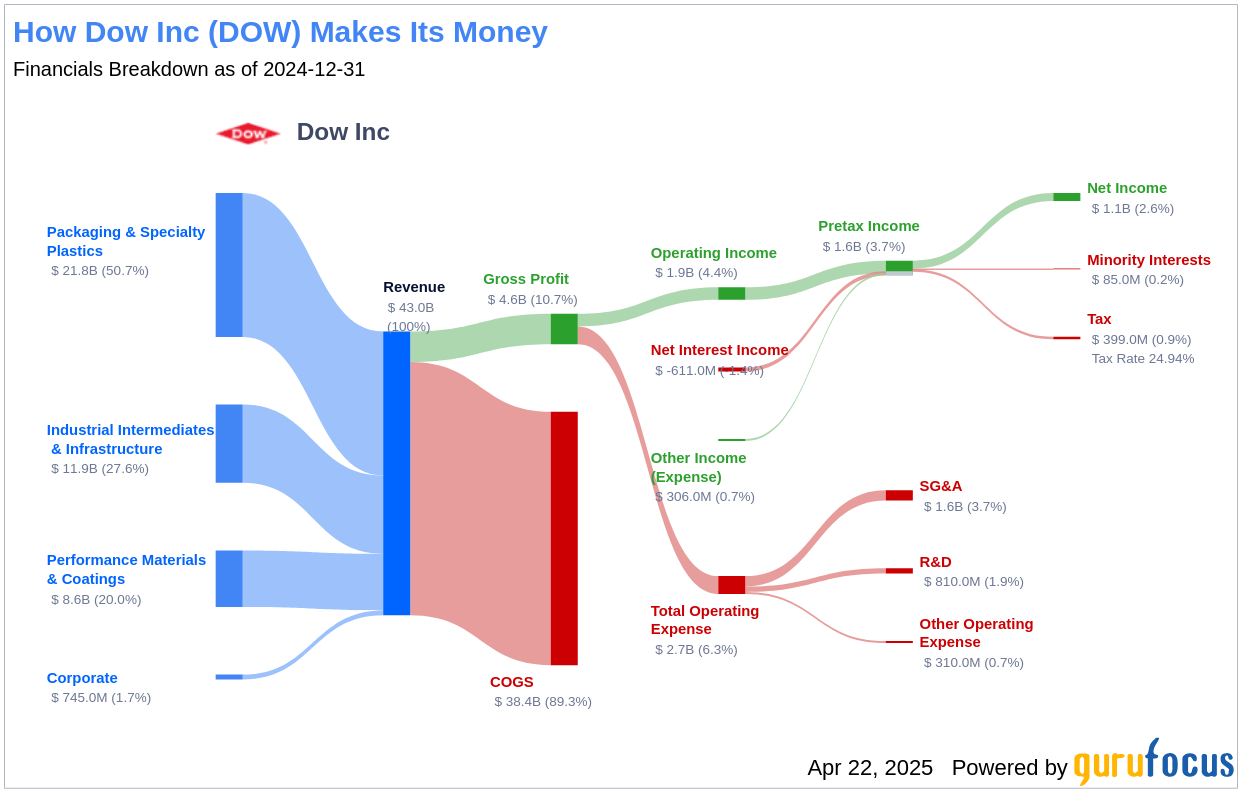
Dow Inc is a diversified chemicals producer, formed in 2019 as a result of the DowDuPont merger and subsequent separations. The firm is a key producer of several chemicals, including polyethylene, ethylene oxide, and silicone rubber. Its products have numerous applications in both consumer and industrial end markets. The company conducts its operations through six businesses, which are organized into segments, such as Packaging & Specialty Plastics, Industrial Intermediates & Infrastructure, and Performance Materials and Coatings. With a market cap of $20.33 billion and sales of $42.96 billion, Dow Inc operates with an operating margin of 4.43%.
Financial Strength Breakdown
Dow Inc's financial strength indicators present some concerning insights about the company's balance sheet health. Dow Inc has an interest coverage ratio of 2.35, which positions it worse than 82.12% of 1,197 companies in the Chemicals industry. This ratio highlights potential challenges the company might face when handling its interest expenses on outstanding debt. It's worth noting that the esteemed investor Benjamin Graham typically favored companies with an interest coverage ratio of at least five.
The company's Altman Z-Score is just 1.83, which is below the safe threshold of 2.99. Although this does not imply immediate danger of financial distress, the stock may face some financial struggles if the Altman Z-score drops below 1.81. Additionally, the company's low cash-to-debt ratio at 0.12 indicates a struggle in handling existing debt levels.
Growth Prospects
A lack of significant growth is another area where Dow Inc seems to falter, as evidenced by the company's low Growth rank. The company's revenue has declined by -6% per year over the past three years, which underperforms worse than 81.81% of 1,473 companies in the Chemicals industry. Stagnating revenues may pose concerns in a fast-evolving market.

Conclusion
In conclusion, Dow Inc's financial strength, profitability, and growth metrics, as highlighted by the GF Score, suggest that the company may face challenges in achieving future outperformance. The company's low interest coverage ratio, declining revenue, and low cash-to-debt ratio are significant factors that could hinder its growth prospects. As value investors, it is crucial to consider these metrics when evaluating Dow Inc's potential for future success. For those seeking companies with strong GF Scores, GuruFocus Premium members can explore more options using the GF Score Screen.
This article, generated by GuruFocus, is designed to provide general insights and is not tailored financial advice. Our commentary is rooted in historical data and analyst projections, utilizing an impartial methodology, and is not intended to serve as specific investment guidance. It does not formulate a recommendation to purchase or divest any stock and does not consider individual investment objectives or financial circumstances. Our objective is to deliver long-term, fundamental data-driven analysis. Be aware that our analysis might not incorporate the most recent, price-sensitive company announcements or qualitative information. GuruFocus holds no position in the stocks mentioned herein.