
Cadence Design Systems Inc (CDNS, Financial) has recently been in the spotlight, drawing interest from investors and financial analysts due to its robust financial stance. With shares currently priced at $263.04, Cadence Design Systems Inc has witnessed a daily gain of 0.95%, marked against a three-month change of -12.53%. A thorough analysis, underlined by the GF Score, suggests that Cadence Design Systems Inc is well-positioned for substantial growth in the near future.

What Is the GF Score?
The GF Score is a stock performance ranking system developed by GuruFocus using five aspects of valuation, which has been found to be closely correlated to the long-term performances of stocks by backtesting from 2006 to 2021. The stocks with a higher GF Score generally generate higher returns than those with a lower GF Score. Therefore, when picking stocks, investors should invest in companies with high GF Scores. The GF Score ranges from 0 to 100, with 100 as the highest rank.
- Financial strength rank: 8/10
- Profitability rank: 10/10
- Growth rank: 10/10
- GF Value rank: 9/10
- Momentum rank: 5/10
Each one of these components is ranked and the ranks also have positive correlation with the long term performances of stocks. The GF score is calculated using the five key aspects of analysis. Through backtesting, we know that each of these key aspects has a different impact on the stock price performance. Thus, they are weighted differently when calculating the total score. With a high GF Score of 97 out of 100, Cadence Design Systems Inc signals the highest outperformance potential.
Understanding Cadence Design Systems Inc Business
Cadence Design Systems Inc is a provider of electronic design automation software, intellectual property, and system design and analysis products. EDA software automates and aids in the chip design process, enhancing design accuracy, productivity, and complexity in a full-flow end-to-end solution. Cadence offers a portfolio of design IP, as well as system design and analysis products, which enables system-level analysis and verification solutions. With a market cap of $72.16 billion and sales of $4.64 billion, Cadence Design Systems Inc boasts an operating margin of 29.62%, reflecting its efficient business operations.

Financial Strength Breakdown
According to the Financial Strength rating, Cadence Design Systems Inc's robust balance sheet exhibits resilience against financial volatility, reflecting prudent management of capital structure. The Interest Coverage ratio for Cadence Design Systems Inc stands impressively at 18.09, underscoring its strong capability to cover its interest obligations. This robust financial position resonates with the wisdom of legendary investor Benjamin Graham, who favored companies with an interest coverage ratio of at least 5.
With an Altman Z-Score of 12.32, Cadence Design Systems Inc exhibits a strong defense against financial distress, highlighting its robust financial stability. With a favorable Debt-to-Revenue ratio of 0.56, Cadence Design Systems Inc's strategic handling of debt solidifies its financial health.
Profitability Rank Breakdown
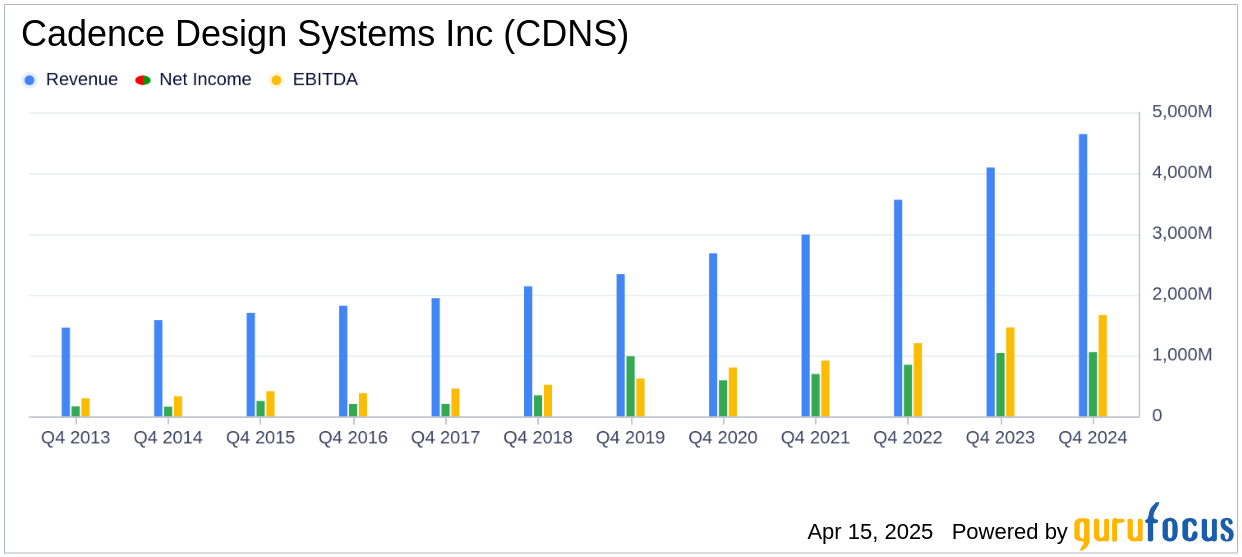
The Profitability Rank shows Cadence Design Systems Inc's impressive standing among its peers in generating profit. Cadence Design Systems Inc's Operating Margin has increased by 21.35% over the past five years, as shown by the following data: 2020: 24.41; 2021: 26.04; 2022: 30.15; 2023: 30.86; 2024: 29.62.
Cadence Design Systems Inc's strong Predictability Rank of 4.5 stars out of five underscores its consistent operational performance, providing investors with increased confidence.
Growth Rank Breakdown
Ranked highly in Growth, Cadence Design Systems Inc demonstrates a strong commitment to expanding its business. The company's 3-Year Revenue Growth Rate is 16.5%, which outperforms better than 70.92% of 2,500 companies in the Software industry.
Moreover, Cadence Design Systems Inc has seen a robust increase in its earnings before interest, taxes, depreciation, and amortization (EBITDA) over the past few years. Specifically, the three-year growth rate stands at 22.8, and the rate over the past five years is 22.9. This trend accentuates the company's continued capability to drive growth.
Conclusion
Cadence Design Systems Inc's financial strength, profitability, and growth metrics, as highlighted by the GF Score, underscore the firm's unparalleled position for potential outperformance. The company's strategic initiatives and robust financial health make it a compelling choice for investors seeking long-term growth. As the industry continues to evolve, Cadence Design Systems Inc's innovative solutions and strong market position are likely to drive further success. For those interested in exploring more companies with strong GF Scores, GuruFocus Premium members can utilize the following screener link: GF Score Screen.
This article, generated by GuruFocus, is designed to provide general insights and is not tailored financial advice. Our commentary is rooted in historical data and analyst projections, utilizing an impartial methodology, and is not intended to serve as specific investment guidance. It does not formulate a recommendation to purchase or divest any stock and does not consider individual investment objectives or financial circumstances. Our objective is to deliver long-term, fundamental data-driven analysis. Be aware that our analysis might not incorporate the most recent, price-sensitive company announcements or qualitative information. GuruFocus holds no position in the stocks mentioned herein.