
Long-established in the Packaging & Containers industry, Smurfit WestRock PLC (SW, Financial) has enjoyed a stellar reputation. It has recently witnessed a daily gain of 0.07%, juxtaposed with a three-month change of 10.11%. However, fresh insights from the GF Score hint at potential headwinds. Notably, its diminished rankings in financial strength, growth, and valuation suggest that the company might not live up to its historical performance. Join us as we dive deep into these pivotal metrics to unravel the evolving narrative of Smurfit WestRock PLC.

What Is the GF Score?
The GF Score is a stock performance ranking system developed by GuruFocus using five aspects of valuation, which has been found to be closely correlated to the long-term performances of stocks by backtesting from 2006 to 2021. The stocks with a higher GF Score generally generate higher returns than those with a lower GF Score. Therefore, when picking stocks, investors should invest in companies with high GF Scores. The GF Score ranges from 0 to 100, with 100 as the highest rank.
- Financial strength rank: 5/10
- Profitability rank: 7/10
- Growth rank: 5/10
- GF Value rank: 1/10
- Momentum rank: 9/10
Based on the above method, GuruFocus assigned Smurfit WestRock PLC the GF Score of 69 out of 100, which signals poor future outperformance potential.
Understanding Smurfit WestRock PLC Business
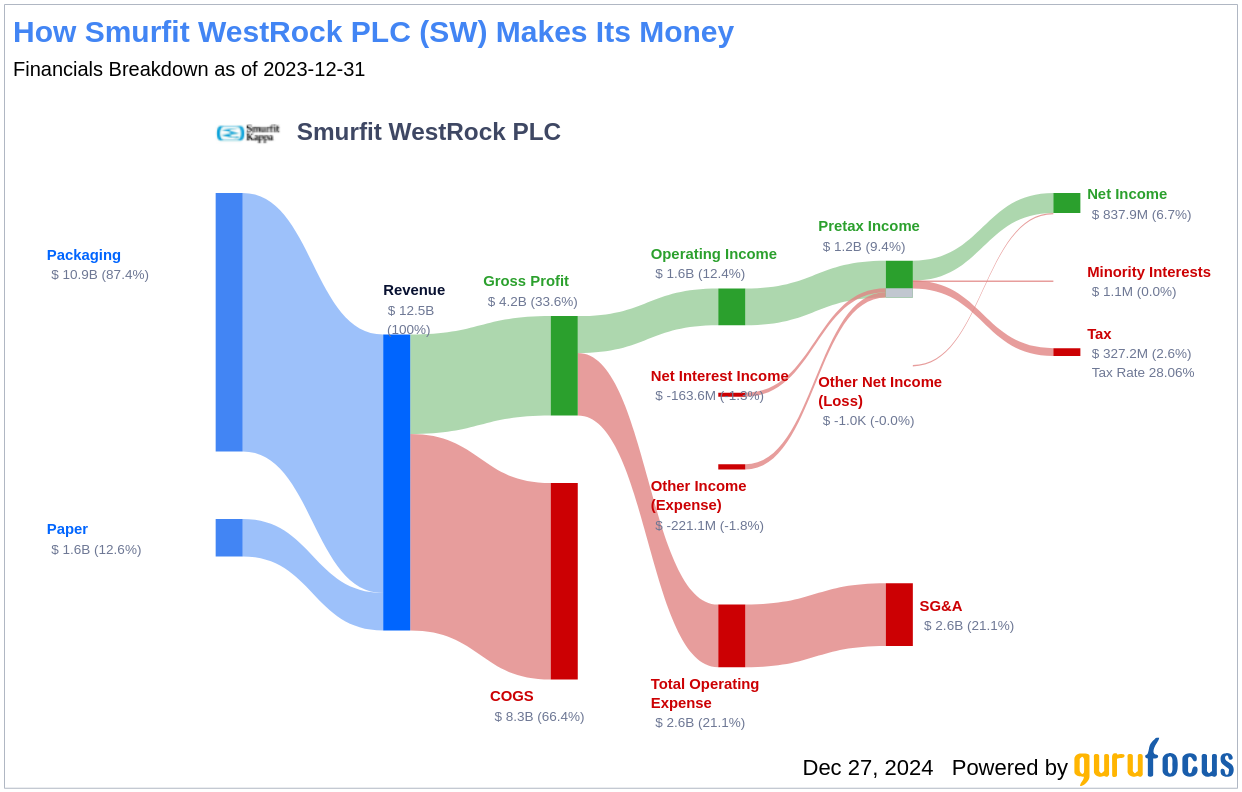
Smurfit WestRock PLC, with a market capitalization of $28.19 billion, is a leading player in the Packaging & Containers industry. The company manufactures corrugated packaging and consumer packaging, such as folding cartons and paperboard. Following the merger of Smurfit Kappa and WestRock in the summer of 2024, Smurfit WestRock became the largest producer of containerboard in the world, with substantial operations in North America, South America, and Europe. The company reported sales of $13.87 billion and an operating margin of 6.98%.
Financial Strength Breakdown
Smurfit WestRock PLC's financial strength indicators present some concerning insights about the company's balance sheet health. Smurfit WestRock PLC has an interest coverage ratio of 3.12, which positions it worse than 67.71% of 319 companies in the Packaging & Containers industry. This ratio highlights potential challenges the company might face when handling its interest expenses on outstanding debt. It's worth noting that the esteemed investor Benjamin Graham typically favored companies with an interest coverage ratio of at least five.
The company's Altman Z-Score is just 1.25, which is below the distress zone of 1.81. This suggests that the company may face financial distress over the next few years. Additionally, the company's low cash-to-debt ratio at 0.07 indicates a struggle in handling existing debt levels.
Additionally, the company's debt-to-Ebitda ratio is 14.76, which is above Joel Tillinghast's warning level of 4 and is worse than 92.92% of 339 companies in the Packaging & Containers industry. Tillinghast said in his book “Big Money Think's Small: Biases, Blind Spots, and Smarter Investing” that a high debt-to-Ebitda ratio can be a red flag unless tangible assets cover the debt.
Conclusion
In conclusion, Smurfit WestRock PLC's financial strength, profitability, and growth metrics, as highlighted by the GF Score, indicate potential challenges in achieving future outperformance. The company's financial indicators, such as the interest coverage ratio, Altman Z-Score, and debt-to-Ebitda ratio, suggest that it may face financial difficulties in the coming years. Investors should carefully consider these factors when evaluating the company's potential for growth and profitability. For those seeking companies with strong GF Scores, GuruFocus Premium members can explore more options using the following screener link: GF Score Screen.
This article, generated by GuruFocus, is designed to provide general insights and is not tailored financial advice. Our commentary is rooted in historical data and analyst projections, utilizing an impartial methodology, and is not intended to serve as specific investment guidance. It does not formulate a recommendation to purchase or divest any stock and does not consider individual investment objectives or financial circumstances. Our objective is to deliver long-term, fundamental data-driven analysis. Be aware that our analysis might not incorporate the most recent, price-sensitive company announcements or qualitative information. GuruFocus holds no position in the stocks mentioned herein.