
Long-established in the Utilities - Regulated industry, Evergy Inc (EVRG, Financial) has enjoyed a stellar reputation. However, it has recently witnessed a daily loss of 0.04%, juxtaposed with a three-month change of 12.52%. Fresh insights from the GF Score hint at potential headwinds. Notably, its diminished rankings in financial strength, growth, and valuation suggest that the company might not live up to its historical performance. Join us as we dive deep into these pivotal metrics to unravel the evolving narrative of Evergy Inc.
What Is the GF Score?
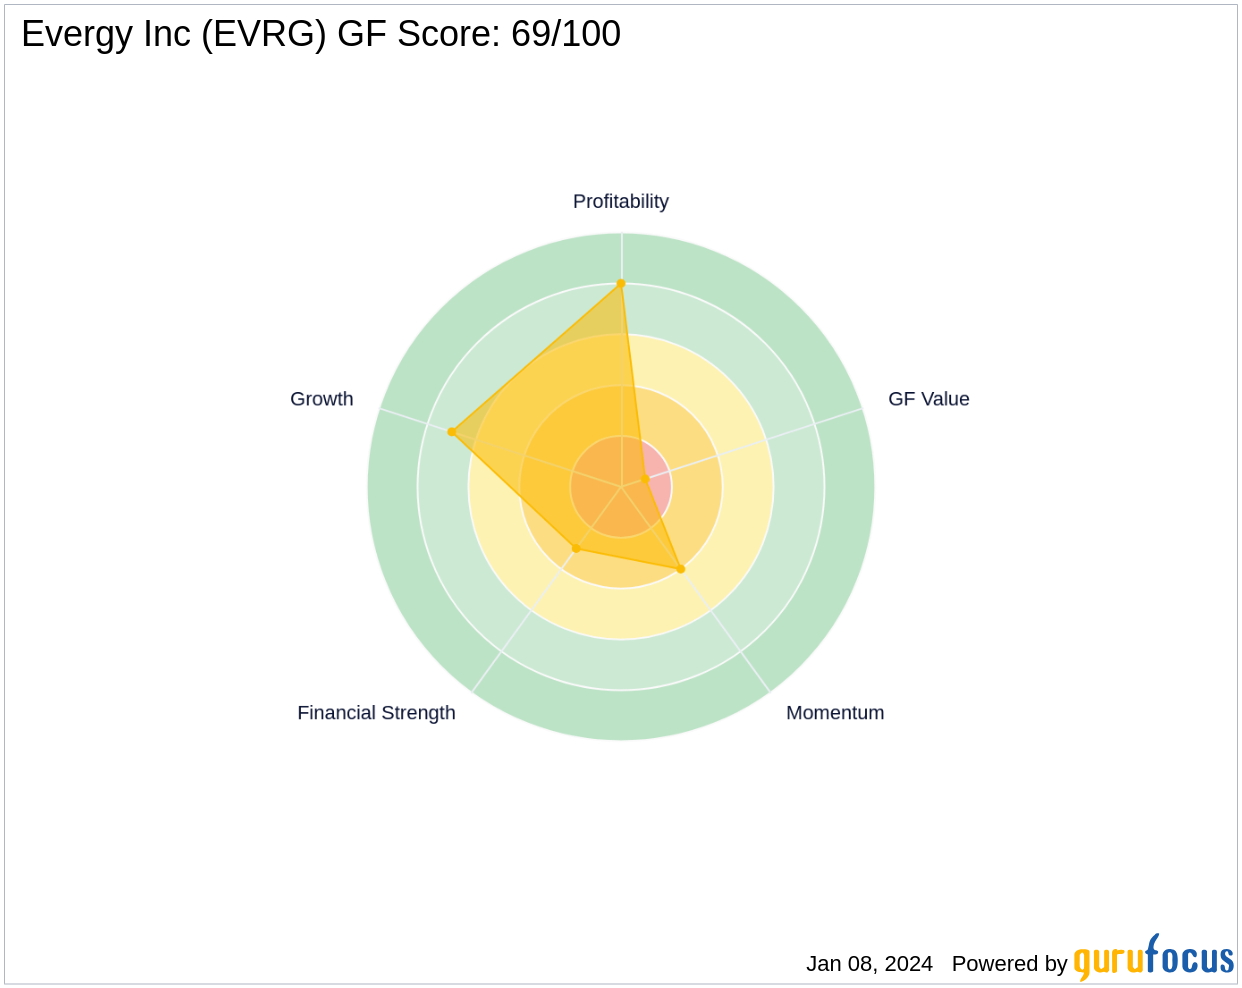
The GF Score is a stock performance ranking system developed by GuruFocus using five aspects of valuation, which has been found to be closely correlated to the long-term performances of stocks by backtesting from 2006 to 2021. The stocks with a higher GF Score generally generate higher returns than those with a lower GF Score. Therefore, when picking stocks, investors should invest in companies with high GF Scores. The GF Score ranges from 0 to 100, with 100 as the highest rank.
- Financial strength rank: 3/10
- Profitability rank: 8/10
- Growth rank: 7/10
- GF Value rank: 1/10
- Momentum rank: 4/10
Based on the above method, GuruFocus assigned Evergy Inc a GF Score of 69 out of 100, which signals poor future outperformance potential.
Understanding Evergy Inc's Business
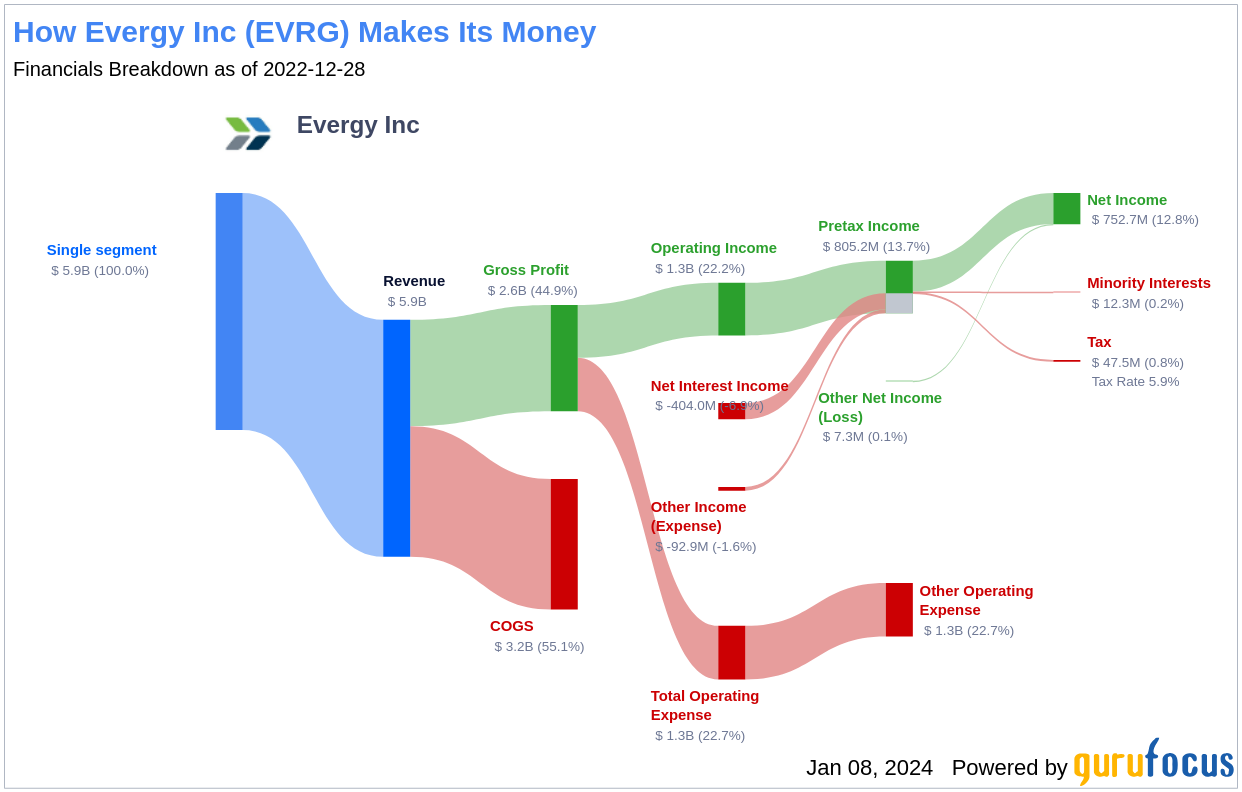
Evergy Inc, with a market cap of $12.33 billion and sales of $5.6 billion, operates as a regulated electric utility serving eastern Kansas and western Missouri. Its major operating subsidiaries include Evergy Metro, Evergy Kansas Central, Evergy Missouri West, and Evergy Transmission Co. The utility has a combined rate base of approximately $19 billion, about half in Kansas and the rest split between Missouri and federal jurisdiction. Notably, Evergy is one of the largest wind energy suppliers in the U.S., showcasing its commitment to sustainable energy solutions.
Financial Strength Breakdown
Evergy Inc's financial strength indicators present some concerning insights about the company's balance sheet health. The interest coverage ratio of 2.44 positions it worse than 70.41% of 436 companies in the Utilities - Regulated industry. This ratio highlights potential challenges the company might face when handling its interest expenses on outstanding debt. The esteemed investor Benjamin Graham typically favored companies with an interest coverage ratio of at least five.
The company's Altman Z-Score is just 0.67, which is below the distress zone of 1.81. This suggests that the company may face financial distress over the next few years. Moreover, the company's low cash-to-debt ratio at 0 indicates a struggle in handling existing debt levels. Additionally, the company's debt-to-Ebitda ratio is 5.59, which is above Joel Tillinghast's warning level of 4 and is worse than 69.72% of 459 companies in the Utilities - Regulated industry. Tillinghast said in his book “Big Money Think's Small: Biases, Blind Spots, and Smarter Investing” that a high debt-to-Ebitda ratio can be a red flag unless tangible assets cover the debt.
Next Steps
Considering Evergy Inc's financial strength, profitability, and growth metrics, the GF Score highlights the firm's unparalleled position for potential underperformance. With a financial strength rank of 3/10 and a GF Value rank of 1/10, the company's ability to navigate future challenges appears limited. Investors should weigh these factors carefully when assessing Evergy Inc's prospects. For those seeking more robust investment opportunities, GuruFocus Premium members can explore companies with strong GF Scores using the following screener link: GF Score Screen.
As Evergy Inc continues to adapt to the evolving energy landscape, will its strategic initiatives and commitment to renewable energy be enough to overcome its financial constraints and drive future growth? Value investors must keep a close eye on these developments to make informed decisions.
This article, generated by GuruFocus, is designed to provide general insights and is not tailored financial advice. Our commentary is rooted in historical data and analyst projections, utilizing an impartial methodology, and is not intended to serve as specific investment guidance. It does not formulate a recommendation to purchase or divest any stock and does not consider individual investment objectives or financial circumstances. Our objective is to deliver long-term, fundamental data-driven analysis. Be aware that our analysis might not incorporate the most recent, price-sensitive company announcements or qualitative information. GuruFocus holds no position in the stocks mentioned herein.