
There is a surprisingly common misconception that Graham recommended evaluating stocks with the formula:
V = EPS x (8.5 + 2g), or
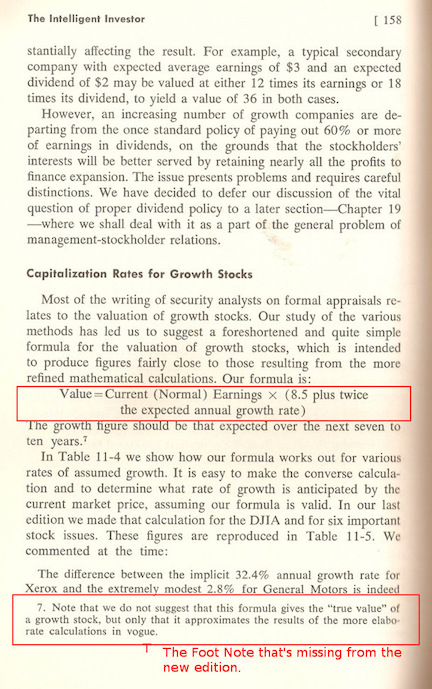
Value = Current (Normal) Earnings x (8.5 plus twice the expected annual growth rate)
An online search for "Benjamin Graham formula" will bring up dozens of stock screeners and analyst reports recommending stocks based on this formula.
(Note: Serenity too uses this formula, but to calculate the market's expected growth rate from the stock price, as Graham intended, and not the other way around.)
What Graham Actually Wrote:
Graham was completely against any kind of charting/technical analysis/forecasting. He always analyzed stocks based on past performance and wrote entire chapters on stock selection. This formula is not mentioned anywhere in them.
He only mentions this formula to show how unrealistic the market's growth expectations are, when seen retrospectively.
A few paragraphs after mentioning this formula, he wrote:
This footnote is missing in more recent editions of the book (it's now in the "endnotes" section, possibly the cause of the confusion). But the warning is present in the new editions as well.
Some Real Graham Stocks:
The stocks mentioned below, at their current prices, meet Graham's criteria for bargain issues, or net-current-asset stocks.
Given below is a sample list of stocks with the highest expected growth rates.
As can be seen, these stocks come with very high PE values, which is also contrary to the myth that Graham only recommended cheap stocks.
Next is a contrasting list of NCAV stocks with the lowest expected growth rates.
The Best Stocks:
And finally, here's a sample list of what Graham called "stocks for the enterprising investor."
Enterprising stocks are not of defensive investment grade, but are of far better quality than simple bargain or NCAV stocks.
The Irony
As can be seen, the actual investment worthiness of a stock is quite independent of the market's expected growth rate for it, and far more complex to calculate.
The above lists are samples only; the complete list of stocks meeting Graham's various sets of investment criteria can be seen on The Benjamin Graham stock screener.
But the irony of this entire story is that the very formula with which Graham meant to show how unrealistic market expectations were, is the formula used the most today as the "Benjamin Graham growth stock formula!" There is perhaps good reason why Graham's protege and most famous student, Warren Buffett, said "Beware of geeks bearing formulas."
Disclaimer: The lists of Graham stocks were arrived at by automated quantitative analysis and were not verified individually. Before making a final investment decision, check for any recent changes, especially for recent stock splits.
V = EPS x (8.5 + 2g), or
Value = Current (Normal) Earnings x (8.5 plus twice the expected annual growth rate)
An online search for "Benjamin Graham formula" will bring up dozens of stock screeners and analyst reports recommending stocks based on this formula.
(Note: Serenity too uses this formula, but to calculate the market's expected growth rate from the stock price, as Graham intended, and not the other way around.)
What Graham Actually Wrote:
Graham was completely against any kind of charting/technical analysis/forecasting. He always analyzed stocks based on past performance and wrote entire chapters on stock selection. This formula is not mentioned anywhere in them.
He only mentions this formula to show how unrealistic the market's growth expectations are, when seen retrospectively.
A few paragraphs after mentioning this formula, he wrote:
Warning: This material is supplied for illustrative purposes only, and because of the inescapable necessity in security analysis to project the future growth rate for most companies studied. Let the reader not be misled into thinking that such projections have any high degree of reliability or, conversely, that future prices can be counted on to behave accordingly as the prophecies are realized, surpassed, or disappointed.There is even a footnote in the original 1973 edition of "The Intelligent Investor" (click here to see a scan) to clarify that this equation doesn't really give any "true value."
This footnote is missing in more recent editions of the book (it's now in the "endnotes" section, possibly the cause of the confusion). But the warning is present in the new editions as well.
Some Real Graham Stocks:
The stocks mentioned below, at their current prices, meet Graham's criteria for bargain issues, or net-current-asset stocks.
Given below is a sample list of stocks with the highest expected growth rates.
| Name | Symbol | Price/ Earnings | Price/ Book | Expected annual growth rate | Graham price | Current price |
| Courier Corp | CRRC | 1,086.00 | 0.88 | 538.75% | $11 | $10.93 |
| PC-Tel Inc | PCTI | 588.00 | 0.95 | 289.75% | $6.38 | $5.85 |
| Prudential Bancorp of PA | PBIP | 521.00 | 0.90 | 256.25% | $5.73 | $5.21 |
| Axis Capital Hldgs Ltd | AXS | 478.71 | 0.71 | 235.11% | $35.48 | $33.81 |
As can be seen, these stocks come with very high PE values, which is also contrary to the myth that Graham only recommended cheap stocks.
Next is a contrasting list of NCAV stocks with the lowest expected growth rates.
| Name | Symbol | Price/ Earnings | Price/ Book | Expected annual growth rate | Graham price | Current price |
| Insignia Systems Inc | ISIG | 0.50 | 0.85 | -4.00% | $2.04 | $1.58 |
| Network Engines Inc | NEI | 1.69 | 0.64 | -3.40% | $2.17 | $1.43 |
| First Bancorp (Puerto Rico) | FBP | 1.70 | 0.53 | -3.40% | $5.82 | $3.57 |
| Amtech Systems Inc | ASYS | 1.78 | 0.36 | -3.36% | $12.34 | $3.89 |
The Best Stocks:
And finally, here's a sample list of what Graham called "stocks for the enterprising investor."
Enterprising stocks are not of defensive investment grade, but are of far better quality than simple bargain or NCAV stocks.
| Name | Symbol | Price/ Earnings | Price/ Book | Required annual growth rate | Graham price | Current price |
| Hewlett-Packard Co | HPQ | 5.63 | 0.90 | -1.44% | $25.04 | $19.70 |
| DeVry Inc | DV | 4.17 | 0.92 | -2.17% | $25.42 | $19.23 |
| Walter Energy Inc. | WLT | 6.43 | 1.06 | -1.04% | $41.77 | $38.89 |
| WellPoint Inc | WLP | 7.54 | 0.77 | -0.48% | $65.25 | $57.91 |
The Irony
As can be seen, the actual investment worthiness of a stock is quite independent of the market's expected growth rate for it, and far more complex to calculate.
The above lists are samples only; the complete list of stocks meeting Graham's various sets of investment criteria can be seen on The Benjamin Graham stock screener.
But the irony of this entire story is that the very formula with which Graham meant to show how unrealistic market expectations were, is the formula used the most today as the "Benjamin Graham growth stock formula!" There is perhaps good reason why Graham's protege and most famous student, Warren Buffett, said "Beware of geeks bearing formulas."
Disclaimer: The lists of Graham stocks were arrived at by automated quantitative analysis and were not verified individually. Before making a final investment decision, check for any recent changes, especially for recent stock splits.