

The name Tyson Foods Inc. (TSN, Financial) will tick many boxes for investors who want growth as well as a reasonable dividend yield from a defensive stock. This is how the share price has risen over the past decade:

And this is how the dividend has grown:

About Tyson
If you’ve eaten meat or proteins in the U.S. lately, chances are high you’ve consumed a Tyson product. According to the company website, 20% of the beef, pork and chicken consumed in the U.S. comes from its facilities. Many of its brands are household names, and were displayed in this slide from a presentation to the Consumer Analyst Group of New York (CAGNY) on Feb. 23, 2022:

It is a $33.84 billion company, and its 137,000 employees produced meat and prepared foods that sold for $47 billion last year. It sources raw materials from 11,000 independent farms, and its output is sold in 140 countries. Reporting is done through four segments: Beef, Pork, Chicken and Prepared Foods.
Growth
Revenue has grown relatively steadily over the past decade:

In the CAGNY presentation, it reported expectations for continuing growth, thanks in part to several tailwinds:
- Population growth in the United States and abroad.
- Gross domestic product, GDP, is expected to increase at home and globally.
- World protein consumption will keep growing, with pork expected to deliver the biggest increase.
- S. animal protein consumption will continue to rise.
- Alternative protein (plant-based) demand will keep increasing.
- Expanding international opportunities, led by consumption growth in Asia and Latin America.
The company will invest $1.8 billion over the next two years to increase plant capacity by 1.3 billion pounds per year. That will increase its chicken capacity by 30% and its pork and beef capacity by 40%.
At the same time, it expects to deliver $1 billion in productivity gains by the end of 2024. These initiatives include operational improvements, digital solutions and automation.
Competition
Tyson does not name competitors in its 10-K, but according to Fortune magazine, there are four major meat processing companies: Cargill, Tyson Foods, JBS SA (JBSAF, Financial) and National Beef Packing.
According to Tyson, competition in the industry is intense. There may not be that many mega-conglomerates, but there are countless smaller producers. GuruFocus compares it with other companies that focus on food products, such as Archer Daniels Midland Co (ADM, Financial) and Bunge Ltd. (BG, Financial).
Moats
As noted above, Tyson owns several well-known consumer brands, many of which hold leading market positions. It also has size, which leads to economies of scale and other advantages over competitors.
The new productivity measures announced recently should enhance that competitiveness. As of Dec. 31, 2021, the company had above-average margins and a return on invested capital (ROIC) of 15.71%.
Risks
Risk factors listed in its 10-K for the fiscal year ended Oct. 2, 2021 include:
- Covid-19: The pandemic and responses to it had adverse effects on the company; any resurgence could affect it again.
- The company is directly and indirectly controlled by members of the Tyson family and their Tyson Limited Partnership. They control 71.04% of the voting stock, so minority shareholders may be disadvantaged.
- Prices of the commodities it buys fluctuate, and could have a material effect on profitability. Similarly, it may be exposed to availability issues.
- Fierce competition may force Tyson to reduce its prices and potentially lower earnings.
- Changes in consumer preferences may hurt the company if it cannot respond.
Financial strength

Meat packing is a capital-intensive industry, so it is no surprise that Tyson has a substantial amount of debt. But what matters is whether the company can generate enough operating income to make its interest payments. In this case, its interest coverage ratio is 12.31, meaning it has an adequate, but not large, cushion. Legendary investor Benjamin Graham would not buy a company that did not have an interest coverage ratio of at least 5.00.
It’s worth noting, too, that the current ratio of 12.31 is the highest the company has enjoyed over the past decade. The lowest was 3.61, while the median was 8.98. That’s backed up by an Altman Z-Score in the safe range.
Investors also can take confidence in the ROIC versus weighted average cost of capital (WACC) gap. As of the most recent full fiscal year (ended in October), its ROIC is 13.22%, while the weighted average cost of capital is just 3.75%, an almost 10-point difference.
Free cash flow has grown too, as shown in this 10-year chart:

Profitability

Tyson receives an excellent score on GuruFocus for profitability, and one that’s reflected in the light and dark green bars in the table. The operating and net margins are above average for the consumer packaged goods industry, while its returns on equity and assets are among the best in the industry. The green bars in the history column indicate the current results are outpacing those earlier in the past 10 years.
Turning to the growth lines, we note mixed results for the company's revenue, earnings and Ebitda per share growth:

Performance
While we’ve seen much to like in Tyson’s results, in the five years ending last Oct. 2, this 10-K chart shows the company has trailed both the S&P 500 and a peer group of stocks over the past five years:

Shareholder returns

The Tyson dividend is close to the approximately 2.00% average of the S&P 500 companies. That’s bolstered by what’s been aggressive growth in the dividend per share payments:
Shareholders have also received modest returns from share repurchases:

This GuruFocus table shows how the company’s shares are distributed (keeping in mind that the family controls more than 70% of voting shares, so the below amounts only represent the remaining 30%):

Valuation

Tyson has a price-earnings ratio that is lower than 80% of other companies in the industry. That helps contribute to a relatively low PEG ratio, since the latter ratio is calculated by dividing the price-earnings ratio by the average five-year Ebitda growth rate (which is 9.70% per year currently). A PEG ratio of 0.94 is very close to the fair-value mark of 1.00.
The GuruFocus Value chart arrives at a similar conclusion:

The discounted cash flow calculator reaches an undervalued valuation. That’s based on a four-out-of-five rating for predictability and the historical 10-year EPS without NRI growth rate of 17.30%:
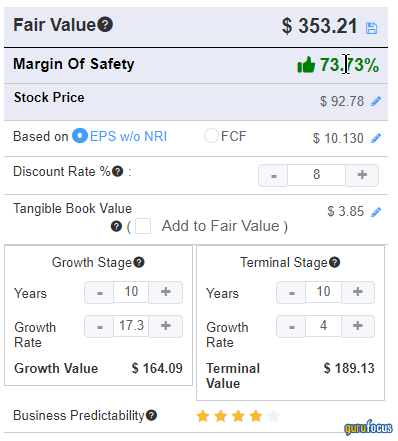
Averaging out the ratings, Tyson has a slightly undervalued to fair value rating.
Gurus
In the final quarter of 2021, the gurus were doing more buying than selling:

Fourteen gurus and their funds had stakes in Tyson as of Dec. 31. The three largest stakes were those of:
- T Rowe Price Equity Income Fund (Trades, Portfolio); its 4,260,000 shares represented 1.17% of Tyson’s Class A shares and 1.97% of the fund’s assets under management.
- Yacktman Asset Management (Trades, Portfolio), which owned 2,752,267 shares after an increase of 1.16%.
- Yacktman Fund (Trades, Portfolio); it held 1,460,000 shares.
Conclusion
Tyson Foods meets several criteria for cautious investors who would like some growth and a growing dividend in their defensive stocks. It has moats that protect its margins, as well as tailwinds and a strong management team using some of its free cash flow to build future revenues and earnings.
It currently pays an average dividend, but if it continues to grow the dividend as it has over the past three years, the dividends per share will soon be better than average.
This stock will not suit value investors, since they cannot point to either a discounted share price or low debt. However, it may be attractive to growth and income investors who want to sleep at night.