

Precious metals markets are under pressure once again as those long gold look for evidence of a sustained turnaround. “Gold as a safe haven asset has been sold off since the S&P 500 broke the 2000 mark,” said Tony Davis, sector analyst at Atlanta Gold and Coin. “But for those looking at metals as a long-term investment, these are clearly some of the best levels we have seen in years, and the current trends mark a very good opportunity to start building exposure.”
In the shorter term, bearish trajectory has been driven by the latest round of macroeconomic figures. Non-farm payrolls for the month of November came in at a very strong 321,000 jobs for the period, far exceeding analyst expectations and removing the need for investors to buy into safe haven assets. But whether or not these types of moves can sustain themselves is another question, and here we look at the longer term historical averages to determine where the key price points can be found in the SPDR Gold Trust ETF (NYSE: GLD) and iShares Silver Trust ETF (NYSE: SLV).
________________________________
SPDR Gold Trust ETF (NYSE: GLD)
Critical Resistance:118
Critical Support: 114.20
Trading Bias: Sideways to Bullish
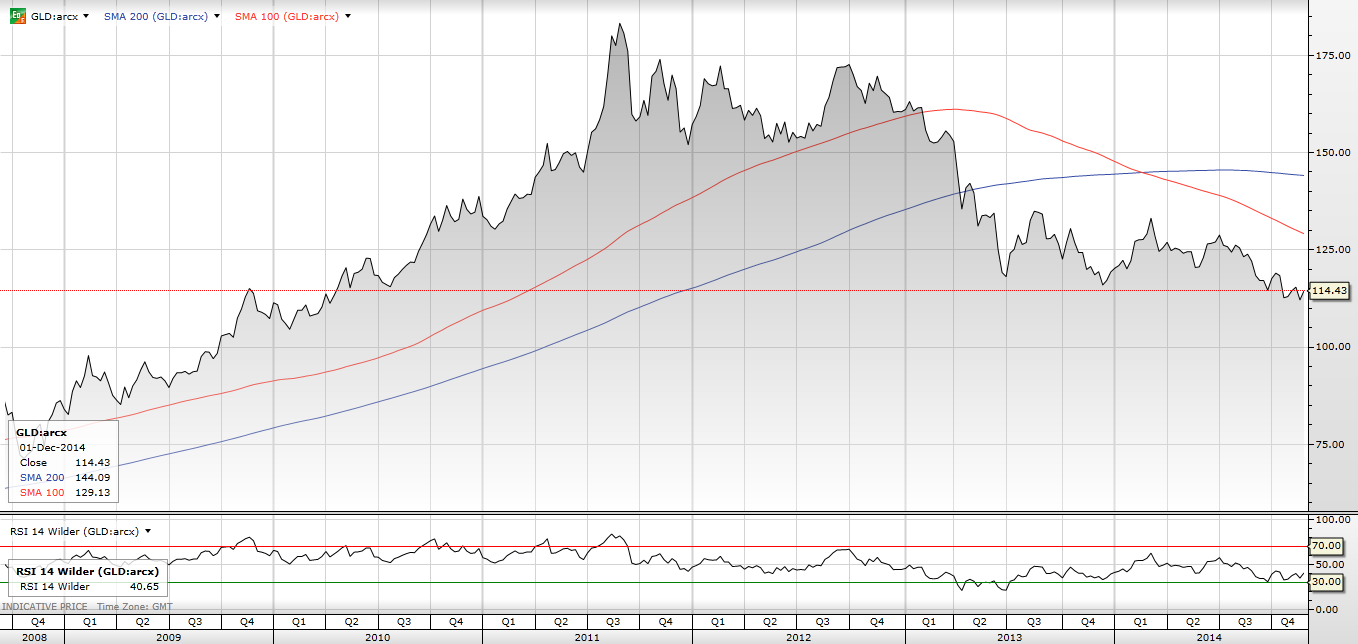
(Chart Source: CornerTrader)
GLD / Gold Trading Strategy: Start looking at long positions in gold, prices have stabilized and rebound opportunities loom.
The medium term downtrend in GLD is undeniable but we have started to see some stabilization in these markets that could suggest a rebound. The downside momentum that began in the early parts of 2013 has run its course at this stage and risk to reward ratios have clearly started to favor the upside. Traders can start to build into long positions at current levels but leverage should be kept to a minimum given the fact that bullish traders are still fighting the broader market. Daily RSI is starting to move higher after bouncing out of oversold territory so any rallies would have room to extend from current levels.
_______________________________________
iShares Silver Trust ETF (NYSE: SLV)
Critical Resistance:21.20
Critical Support: 15.00
Trading Bias: Sideways to Bullish
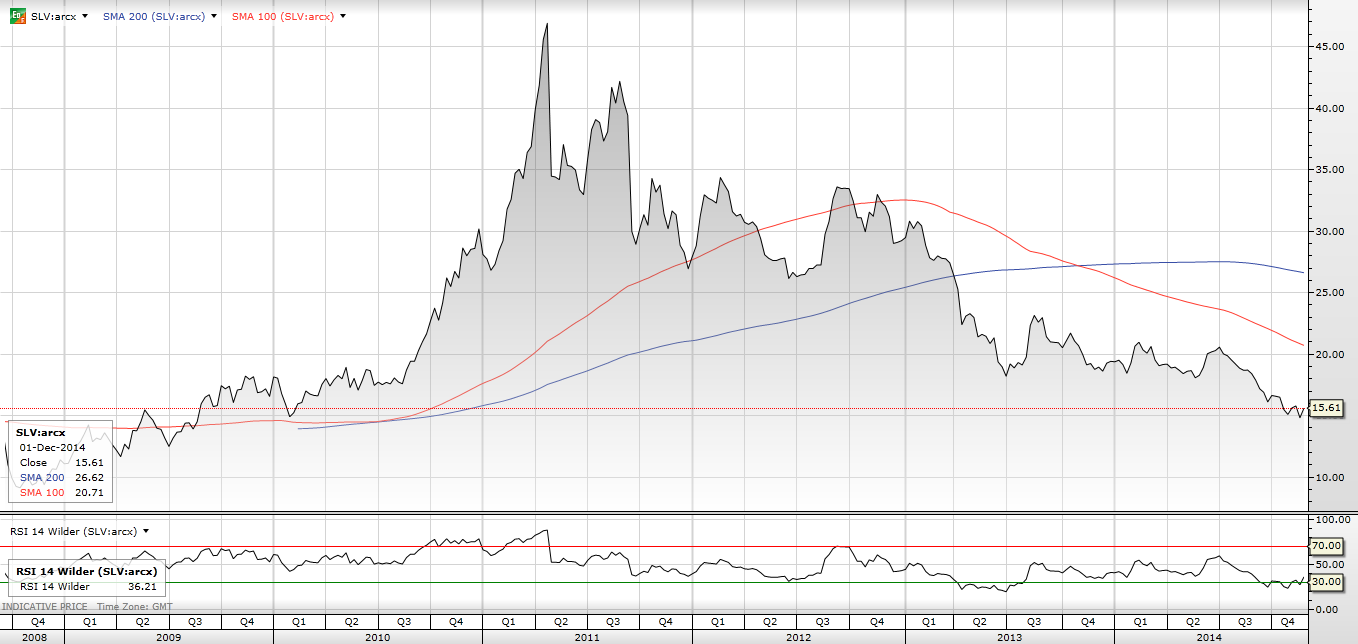
(Chart Source: CornerTrader)
SLV / Silver Trading Strategy: Structural support is now the name of the game as the rallies have run their course. Look to start buying into psychological levels at 15.00.
Downside moves in SLV have been more pronounced than what has been seen in GLD and the stabilization structure here is less apparent. For this reason, it makes sense to hold off on long positions in SLV (and the silver complex as a whole) until we start to see better indicators showing a bottom. On the positive side, we are seeing a divergence between the price/indicators relationship and the Daily RSI readings. So if we do start to see some support ranges form on the shorter-term charts, we could have a basis for new long positions. In any case, risk to reward does not favor shorts given the amount of downside we have seen in the last year. Watch for a break of 17.20 to change the bias.
_______________________________________
United States Oil Fund LP ETF (NYSE: USO)
Critical Resistance:28.30
Critical Support: 24.40
Trading Bias: Still Bearish
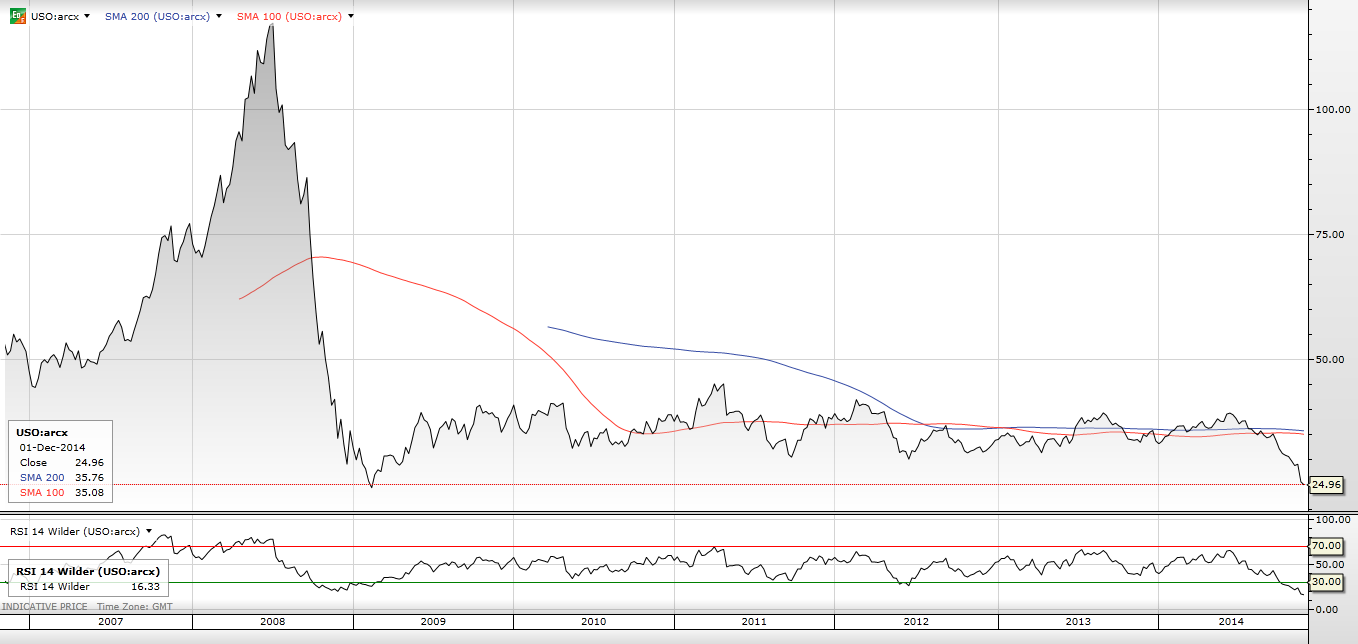
(Chart Source: CornerTrader)
USO / Crude Oil Trading Strategy: Momentum still clearly favors the downside but trends can only last for so long in one direction. Stay on the sidelines and wait for opportunities in contrarian positions.
The USO ETF has been on a wild ride this year, and there is still no clear reversal evidence that can be used for long positions. Momentum traders are still focused on the downside, but trends can only last for so long and those positioned short will need to start thinking about exit points to take profits on their trades. This does point to a positive scenario for those with a longer term bias but these positions will need to be scaled into as there is still the possibility of further downside. The Daily RSI indicator is still falling but we are running out of room here for further downside.