
1 The Company
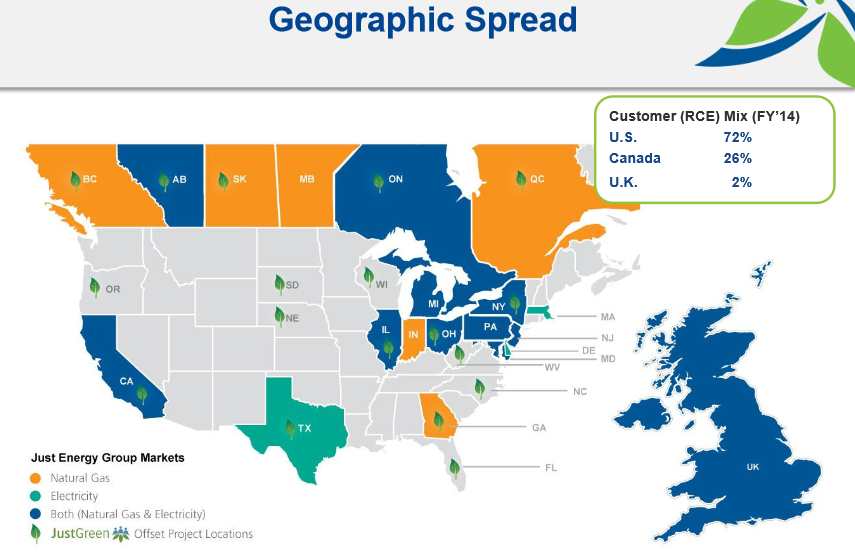
Just Energy Group (JE, Financial) primarily retails natural gas and electricity in the United States, Canada, and the United Kingdom.
| Shares outstanding (May 23, 2014) | 143,982,175 |
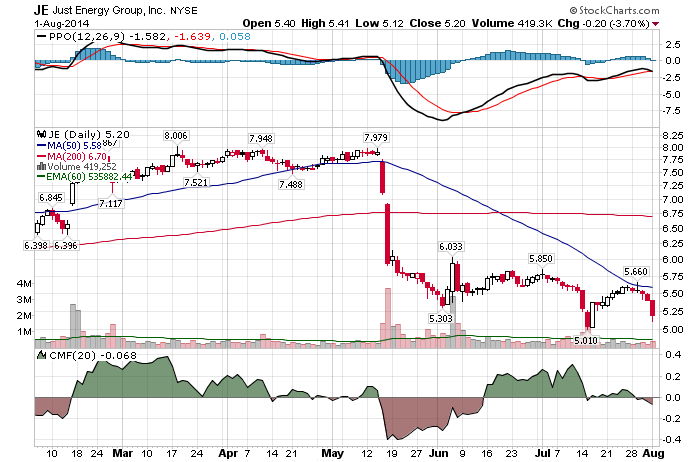
| Share price | $5.20 |
| Market cap | $748.7 million |
| Enterprise value | $1.5 billion |
| P/S | 0.2 |
| P/E | 6.0 |
| Dividend | C$0.50 per year |
| Dividend yield | 8.8% |
| Tickers | JE,TSX:JE |
(Source: Investor presentation)
1.1 History
- Just Energy was established in 1997.
- The company had its initial public offering in 2001.
- On January 30, 2012, the company’s shares commenced trading on the NYSE.
- On July 23, 2012, the company commenced marketing electricity to customers in the United Kingdom.
1.2 Business Model
Just Energy's business primarily involves the sale of natural gas and/or electricity to residential and commercial customers under long-term fixed-price, price-protected or variable-priced contracts and green energy products. Just Energy derives its margin or gross profit from the difference between the price at which it sells the commodities and the price at which it purchases the associated volumes from its suppliers.
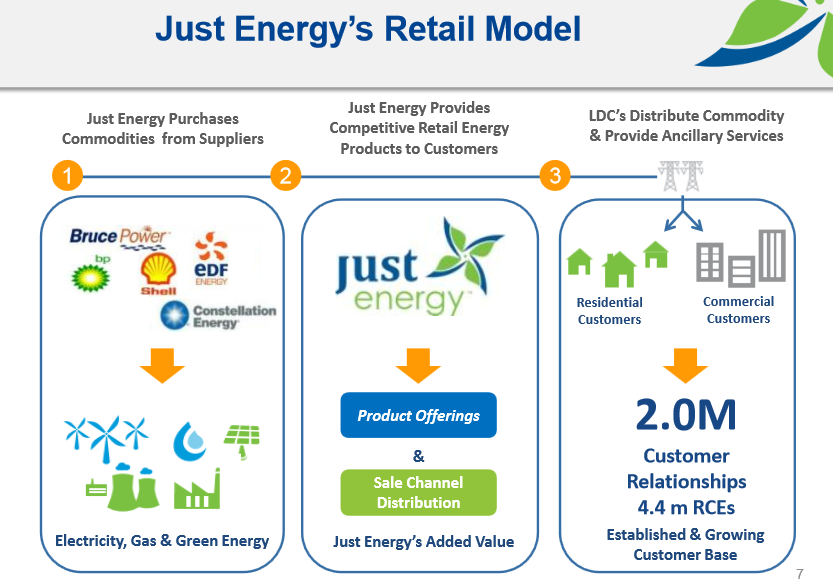
(Source: Investor presentation)
2 Management
Rebecca MacDonald was the principal founder of Just Energy and has held the position of Executive Chair since the IPO. She has been engaged in the deregulation of natural gas for over 22 years.
The company appointed two co-chief executive officers on April 1. James Lewis, co-chief executive officer, joined Just Energy in 2007 and brings 17 years of experience in the energy marketing industry. Deborah Merril, co-chief executive officer, has 20 years of energy marketing experience.
2.1 Insider Ownership
Just Energy’s directors and executive officers own 5.6% of the company.
Here is a table of Just Energy’s insider activity by calendar month.
| Insider buying / shares | Insider selling / shares | |
| July 2014 | 634,778 | 0 |
| June 2014 | 1,003,000 | 30,309 |
| May 2014 | 0 | 0 |
| April 2014 | 0 | 0 |
| March 2014 | 1,000 | 0 |
| February 2014 | 354,000 | 0 |
| January 2014 | 1,490,900 | 0 |
| December 2013 | 364,600 | 0 |
| November 2013 | 430,545 | 0 |
| October 2013 | 0 | 0 |
| September 2013 | 0 | 0 |
| August 2013 | 0 | 0 |
| July 2013 | 0 | 0 |
| June 2013 | 7,500 | 0 |
| May 2013 | 0 | 0 |
| April 2013 | 0 | 0 |
| March 2013 | 95,800 | 0 |
| February 2013 | 22,472 | 0 |
| January 2013 | 0 | 0 |
(Note: The table doesn't include shares acquired or disposed pursuant to a purchase/ownership plan. There have been 78,703 shares purchased pursuant to a purchase/ownership plan since January 2013.)
There have been 4,404,595 shares purchased and there have been 30,309 shares sold by insiders since January 2013.
2.2 Compensation
Here is a table of the management’s compensation during the last three years.
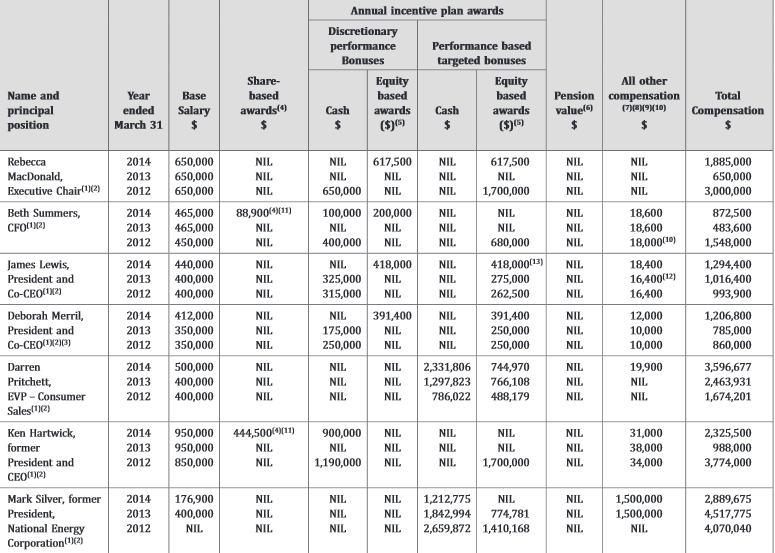
(Source: Management Information Circular)
Six of these seven officers earned more than $1 million in the fiscal year 2014.
3 Operating Summary
Here is a table of Just Energy’s number of customers.
| Fiscal Year | Consumer Customer Base | Commercial Customer Base | NHS Installed Units | Total Customer Base |
| 2005 | N/A | N/A | N/A | 1,235,000 |
| 2006 | N/A | N/A | N/A | 1,502,000 |
| 2007 | N/A | N/A | N/A | 1,659,000 |
| 2008 | N/A | N/A | N/A | 1,687,000 |
| 2009 | N/A | N/A | N/A | 1,790,000 |
| 2010 | N/A | N/A | N/A | 2,293,000 |
| 2011 | 1,984,000 | 1,330,000 | 119,000 | 3,433,000 |
| 2012 | 1,969,000 | 1,901,000 | 165,000 | 4,035,000 |
| 2013 | 1,989,000 | 2,233,000 | 235,000 | 4,457,000 |
| 2014 | 1,979,000 | 2,431,000 | 297,000 | 4,707,000 |
The total customer base has grown 281% since 2005.
4 Financial Summary
4.1 Current Situation
Just Energy reported the fiscal 2014 full-year, which ended March 31, financial results on May 15 with the following highlights:
| Revenue | C$3.6 billion |
| Net income from continuing operations | C$166.2 million |
| Cash | C$123.9 million |
| Debt | C$982.0 million |

(Source: Investor presentation)
The stock plunged after these results due to adverse weather conditions in the fourth quarter, which resulted in fiscal 2014 EBITDA growth of 22%, less than the target growth.
On June 5, Just Energy announced an agreement to sell National Home Services to Reliance Comfort for $505 million. Before the NHS sale, Just Energy sold Terra Grain Fuels in December, 2013. Just Energy’s debt will be substantially reduced after these asset sales.

(Source: Investor presentation)
4.2 Historical Developments
Here is a table of Just Energy’s revenue and earnings since 2005.
| Fiscal Year | 2005 | 2006 | 2007 | 2008 | 2009 | 2010 | 2011 | 2012 | 2013 | 2014 |
| Revenue (C$ billions) | 0.9 | 1.2 | 1.5 | 1.7 | 1.9 | 2.3 | 3.0 | 2.8 | 3.0 | 3.6 |
| Net income / loss (C$ millions) | +37.2 | +51.6 | +93.9 | +152.8 | -1,107.5 | +231.5 | +352.9 | -126.6 | +524.6 | +166.2 |
| EPS | +0.35 | +0.48 | +0.88 | +1.41 | -10.03 | +1.79 | +2.40 | -0.92 | +3.27 | +0.94 |
The revenue has grown 300% since 2005.
5 Shares
Here is a table of Just Energy’s number of shares since 2005.
| Fiscal Year | 2005 | 2006 | 2007 | 2008 | 2009 | 2010 | 2011 | 2012 | 2013 | 2014 |
| Number of shares (millions) | 105.7 | 106.6 | 106.8 | 108.9 | 111.4 | 134.3 | 137.0 | 139.3 | 142.0 | 143.8 |
Just Energy’s number of shares have grown 36% since 2005, but revenue has grown 300%.
6 Outlook
Just Energy’s fiscal 2015 base EBITDA guidance is in the range of $163 million to $173 million. The fiscal 2015 guidance is lower than the fiscal 2014 reported base EBITDA due to the National Home Services asset sale.
Just Energy’s future growth opportunities include expansion in the U.K. and residential solar.
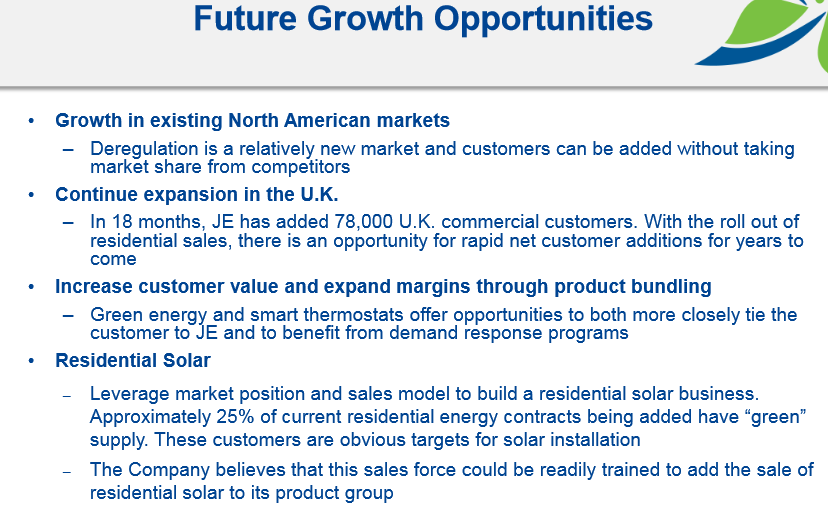
(Source: Investor presentation)
7 Valuation
The Peter Lynch chart values the company at $11.1.
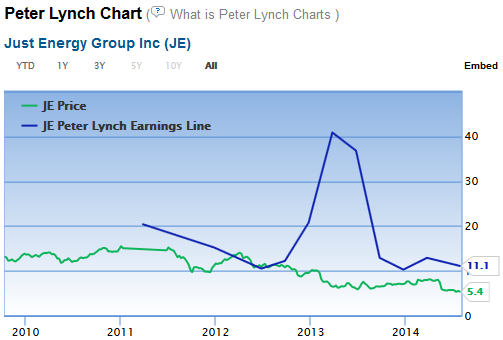
(Source: GuruFocus)
According to the GuruFocus Fair Value/DCF calculator, Just Energy's fair value is $9.64.
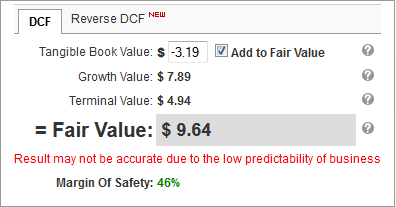
(Source: GuruFocus)
8 Risks
I believe the main risks for the stock include high attrition and low renewal rates. During the fiscal year 2014, the consumer segment attrition was very high at 27% and the commercial segment renewal rate was very low at only 64%.

(Source: Investor presentation)
9 Conclusion
The stock offers both growth and income to investors. I believe the recent sell-off presents a good entry point for the stock, which has been confirmed by the insider buying during the last two months.
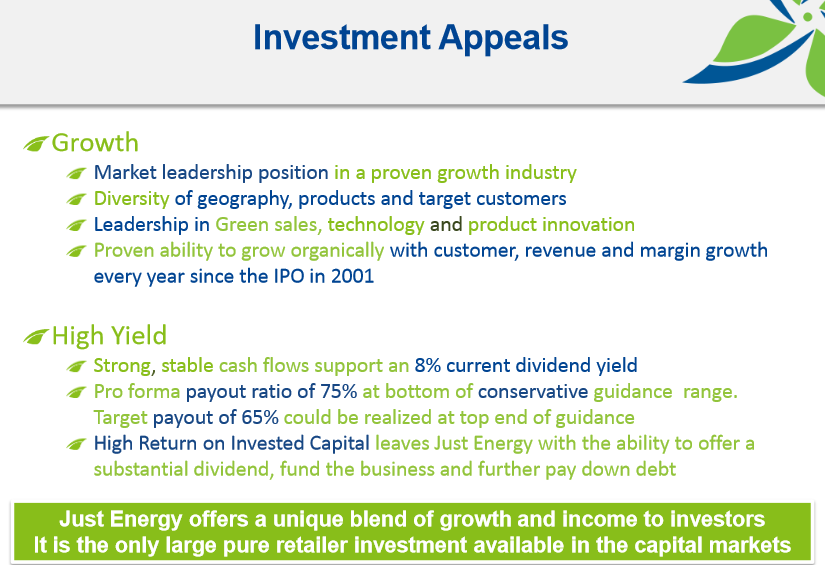
(Source: Investor presentation)
Disclosure: The author has no positions in any stocks mentioned.