

With a notable daily gain of 7.08% and a three-month gain of 40.95%, REV Group Inc (REVG, Financial) presents a compelling case for investors seeking growth. However, the critical question remains: is the stock significantly overvalued? To address this, we will delve into a valuation analysis of REV Group, considering its Earnings Per Share (EPS) of 4.05 and other key financial metrics. Join us as we explore the intrinsic worth of REV Group and what it means for potential investors.
Company Introduction
REV Group Inc is a leading United States-based manufacturer and distributor of specialty vehicles, catering to a diverse range of needs from essential services to consumer leisure. The company's segments include Fire & Emergency, Commercial, and Recreation, with the majority of its revenue stemming from its Fire & Emergency segment. With a current stock price of $22.09 and a GF Value of $15.68, indicating the estimated fair value, REV Group (REVG, Financial) is positioned as significantly overvalued by GuruFocus's proprietary valuation model. This initial comparison sets the stage for a deeper examination of the company's true valuation.

Understanding the GF Value
The GF Value is a unique measure that reflects the intrinsic value of a stock, integrating historical trading multiples, an adjustment factor based on past performance, and future business performance projections. If a stock trades significantly above this line, it is considered overvalued and may yield poorer returns in the future. Conversely, trading below the GF Value Line suggests a potential for higher future returns. With a market cap of $1.10 billion, REV Group's stock price exceeds its GF Value, suggesting an overvaluation that could result in lower long-term returns compared to the company's growth.

Financial Strength of REV Group
Investing in companies with robust financial strength can mitigate the risk of capital loss. A key indicator of financial health is the cash-to-debt ratio, where REV Group boasts a ratio of 2.47, outperforming 78.1% of its industry peers. This strength is further supported by a GuruFocus financial strength ranking of 8 out of 10, underscoring the company's strong financial position.

Profitability and Growth Prospects
Companies with consistent profitability and high profit margins are often safer investment bets. REV Group has maintained profitability for 8 out of the past 10 years, with a revenue of $2.60 billion and an operating margin of 4.04%. Although its operating margin ranks lower compared to some industry counterparts, the company's growth prospects are promising. The average annual revenue growth of REV Group is 7.3%, with a remarkable 3-year average EBITDA growth of 82.5%, positioning it well within its industry.
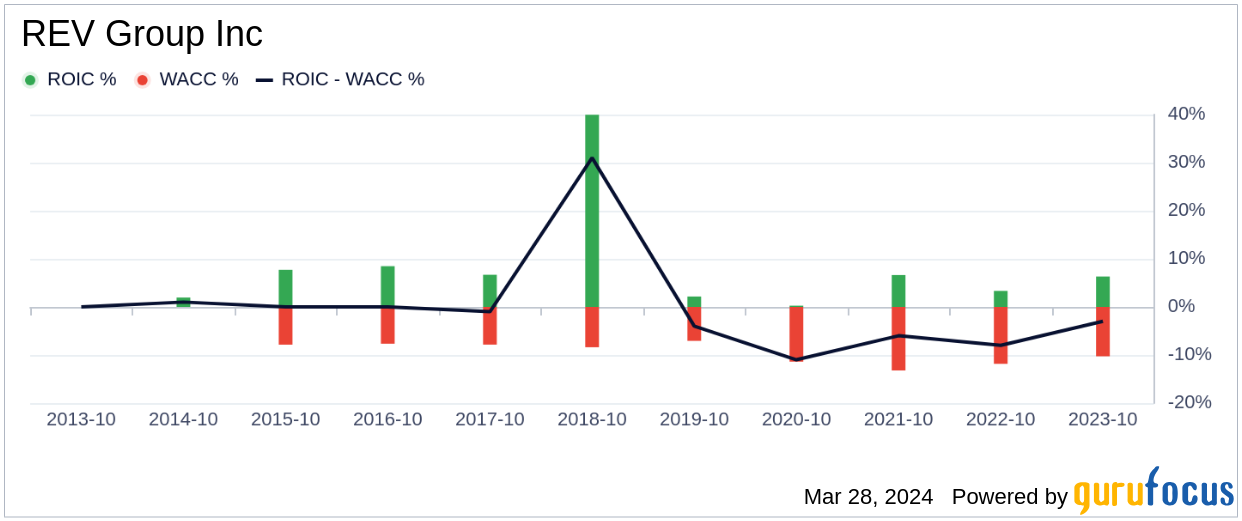
Comparing ROIC and WACC
Evaluating a company's return on invested capital (ROIC) against its weighted average cost of capital (WACC) can provide insights into its value creation capabilities. REV Group's ROIC stands at 7.3, which is unfortunately lower than its WACC of 10.45, suggesting that the company may not be generating sufficient returns on its investments.
Conclusion
In conclusion, REV Group (REVG, Financial) appears to be significantly overvalued based on current estimates. Despite a strong financial condition and fair profitability, the company's valuation exceeds its intrinsic value as indicated by the GF Value. The growth outperformance within its industry is notable, yet investors should be cautious due to the potential misalignment between price and value. For a more detailed financial overview, interested parties can explore REV Group's 30-Year Financials here.
To discover high-quality companies that may deliver above-average returns with reduced risk, consider the GuruFocus High Quality Low Capex Screener.
This article, generated by GuruFocus, is designed to provide general insights and is not tailored financial advice. Our commentary is rooted in historical data and analyst projections, utilizing an impartial methodology, and is not intended to serve as specific investment guidance. It does not formulate a recommendation to purchase or divest any stock and does not consider individual investment objectives or financial circumstances. Our objective is to deliver long-term, fundamental data-driven analysis. Be aware that our analysis might not incorporate the most recent, price-sensitive company announcements or qualitative information. GuruFocus holds no position in the stocks mentioned herein.