

Best Buy Co Inc (BBY, Financial) has recently experienced a daily loss of 3.66%, yet it has managed to gain 7.47% over the past three months. With an Earnings Per Share (EPS) of $5.69, investors may wonder if the stock is fairly valued. This article delves into a valuation analysis to determine the intrinsic worth of Best Buy Co, inviting readers to explore the comprehensive financial assessment that follows.
Company Introduction
Best Buy Co Inc (BBY, Financial), with a commanding market share and a significant retail presence, has consolidated sales reaching $43.50 billion. As the largest pure-play consumer electronics retailer in the U.S., Best Buy Co has a substantial offline and online footprint. The company's stock price is currently at $77.92, with a market cap of $16.80 billion. When compared to the GF Value of $78.7, a measure of fair value, Best Buy Co appears to be trading at a price that closely reflects its intrinsic value. This sets the stage for an in-depth examination of the company's financial health and growth prospects.

Summarize GF Value
The GF Value is a proprietary metric that captures the intrinsic value of a stock, factoring in historical trading multiples, a GuruFocus adjustment for past performance and growth, alongside future business performance estimates. Best Buy Co (BBY, Financial) is currently deemed fairly valued, indicating that its stock price is in line with the GF Value Line. This suggests that the stock's future returns could be consistent with the company's business growth rate.

Because Best Buy Co is fairly valued, the long-term return of its stock is likely to be close to the rate of its business growth. Investors seeking companies that may deliver higher future returns at reduced risk can consider the GuruFocus High Quality Low Capex Screener.
Financial Strength
Investing in companies with solid financial strength is crucial to minimize the risk of permanent capital loss. Best Buy Co's financial strength, with a cash-to-debt ratio of 0.36, ranks in the middle tier of the Retail - Cyclical industry. The company's overall financial strength is rated 7 out of 10, reflecting a fair financial condition.

Profitability and Growth
Best Buy Co's profitability is robust, with a track record of consistent profitability over the past decade. The company's operating margin stands at 3.98%, showcasing its ability to sustain above-average profit margins. Regarding growth, Best Buy Co's 3-year average annual revenue growth rate is 3.4%, which, while not leading the industry, still demonstrates a stable expansion trajectory.
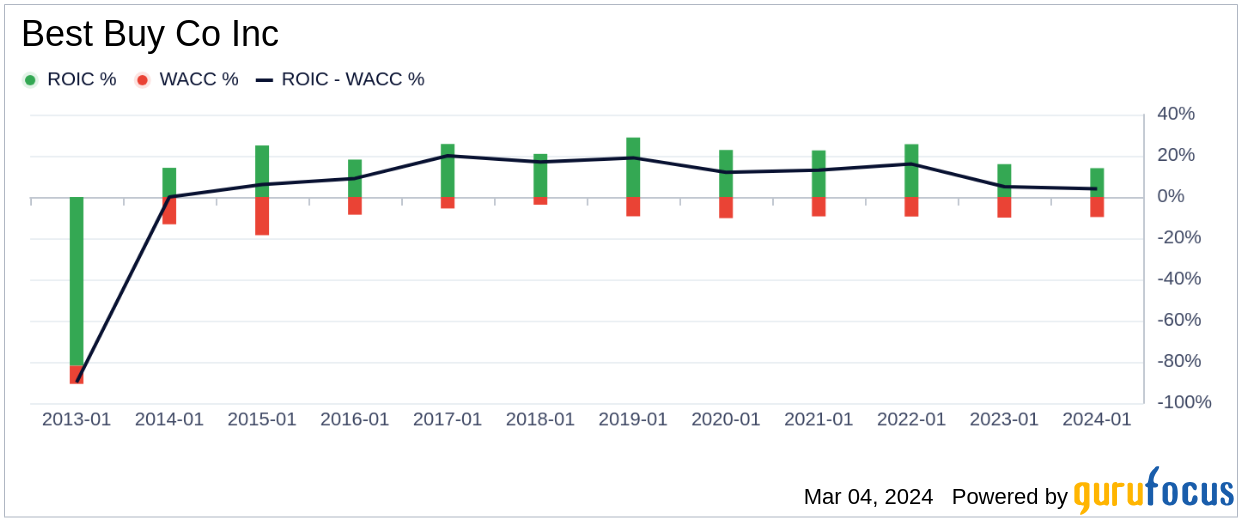
ROIC vs WACC
Comparing a company's Return on Invested Capital (ROIC) to its Weighted Average Cost of Capital (WACC) provides insight into its efficiency in creating shareholder value. Best Buy Co's ROIC of 14.21% significantly surpasses its WACC of 10.02%, indicating the company's effective capital allocation and value creation.
Conclusion
In summary, Best Buy Co Inc (BBY, Financial) is currently trading at a price that aligns with its fair value, as estimated by the GF Value. The company boasts a fair financial condition and strong profitability, though its growth rate is not leading the industry. For a more detailed understanding of Best Buy Co's financials, one can examine its 30-Year Financials here.
To discover high-quality companies that may offer above-average returns, take a look at the GuruFocus High Quality Low Capex Screener.
This article, generated by GuruFocus, is designed to provide general insights and is not tailored financial advice. Our commentary is rooted in historical data and analyst projections, utilizing an impartial methodology, and is not intended to serve as specific investment guidance. It does not formulate a recommendation to purchase or divest any stock and does not consider individual investment objectives or financial circumstances. Our objective is to deliver long-term, fundamental data-driven analysis. Be aware that our analysis might not incorporate the most recent, price-sensitive company announcements or qualitative information. GuruFocus holds no position in the stocks mentioned herein.