

Williams-Sonoma Inc (WSM, Financial) has recently shown a notable daily gain of 6.23% and an impressive three-month gain of 29.77%. With an Earnings Per Share (EPS) of $14.47, investors are keenly observing its performance. A critical question arises: Is Williams-Sonoma's stock fairly valued? The following analysis aims to shed light on this question by delving into the company's valuation.
Company Overview
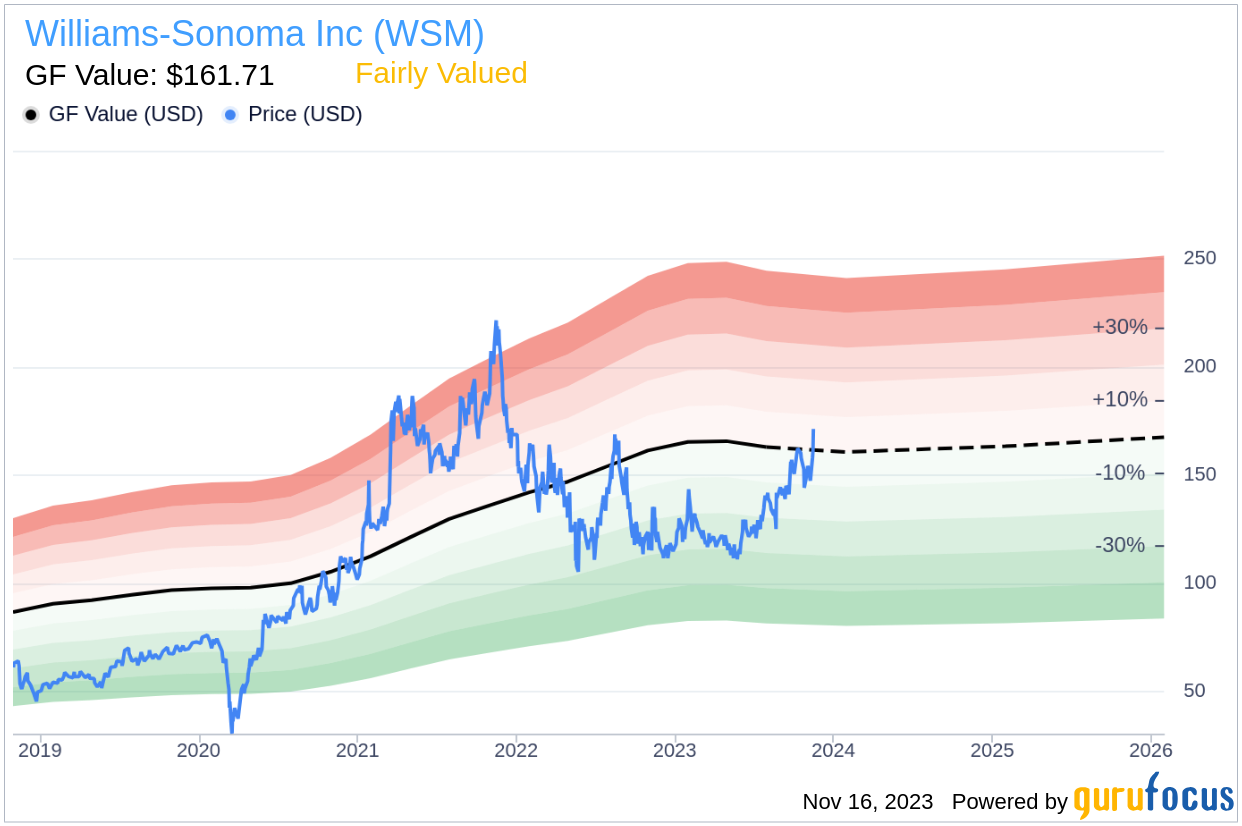
Williams-Sonoma Inc (WSM, Financial) is a dominant force in the $300 billion domestic home category, with a strategic focus on expanding its B2B, marketplace, and franchise segments. With a diverse portfolio of brands, including the high-end Williams-Sonoma and the casual home accessory provider Pottery Barn, the company caters to a variety of consumer needs. The emerging West Elm brand targets young professionals, while Rejuvenation offers lighting and house parts. A strong business-to-business team bolsters Williams-Sonoma's presence, ranging from residential to large-scale commercial projects. By comparing the current stock price of $171.45 to the GF Value of $161.71, we initiate a comprehensive exploration of the company's intrinsic value.

Understanding the GF Value
The GF Value is a proprietary measure that represents the intrinsic value of a stock. This valuation is based on historical trading multiples, a GuruFocus adjustment factor reflecting past returns and growth, and future business performance estimates. According to this measure, Williams-Sonoma appears to be fairly valued, with a market cap of $11 billion. This suggests that the stock price is in line with what is considered an equitable trading value. As a result, the stock's long-term return is likely to mirror the company's business growth rate.
Financial Strength
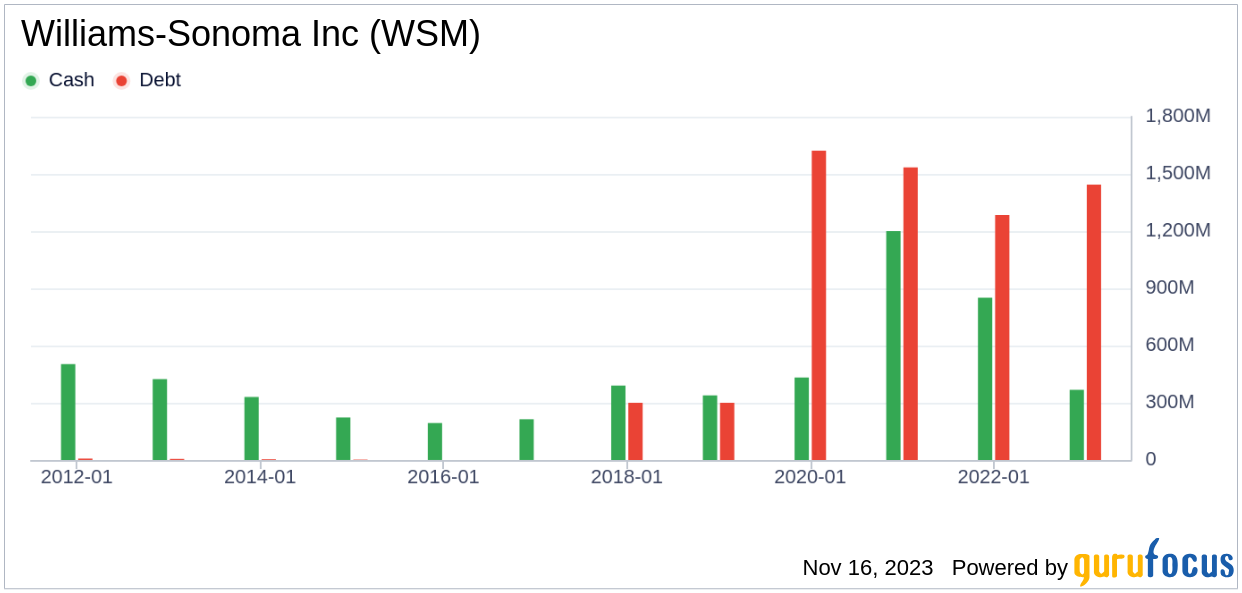
Investing in companies with robust financial strength is crucial to minimize the risk of capital loss. Evaluating metrics such as the cash-to-debt ratio and interest coverage provides insight into a company's financial resilience. Williams-Sonoma's cash-to-debt ratio stands at 0.37, a figure that outperforms 44.5% of companies in the Retail - Cyclical industry. This indicates that the company's financial strength is fair, with a GuruFocus ranking of 5 out of 10.
Profitability and Growth
Consistent profitability over time is a hallmark of a less risky investment. Williams-Sonoma has a commendable track record, with a decade of profitability. The company boasts a revenue of $8.30 billion and an operating margin of 15.5%, ranking it above 89.17% of its peers in the Retail - Cyclical industry. Its profitability is ranked at 9 out of 10, reflecting strong performance.
Growth is a vital indicator of a company's potential to create shareholder value, particularly when it is profitable. Williams-Sonoma's 3-year average annual revenue growth rate of 19% surpasses 81.22% of its industry counterparts. Furthermore, the 3-year average EBITDA growth rate of 44.3% ranks higher than 88.37% of companies in the Retail - Cyclical industry, underscoring the company's robust growth trajectory.
ROIC vs. WACC
Comparing a company's Return on Invested Capital (ROIC) to its Weighted Average Cost of Capital (WACC) is another method to assess profitability. Williams-Sonoma's ROIC of 28.56 significantly exceeds its WACC of 10.73, indicating that the company is effectively creating value for its shareholders.

Final Thoughts
Overall, Williams-Sonoma's stock is fairly valued, reflecting the company's stable financial condition and strong profitability. Its growth outperforms a significant portion of the industry, further solidifying its position in the market. For a more detailed look into Williams-Sonoma's financials, interested investors can view its 30-Year Financials here.
To discover high-quality companies that may deliver above-average returns, visit the GuruFocus High Quality Low Capex Screener.
This article, generated by GuruFocus, is designed to provide general insights and is not tailored financial advice. Our commentary is rooted in historical data and analyst projections, utilizing an impartial methodology, and is not intended to serve as specific investment guidance. It does not formulate a recommendation to purchase or divest any stock and does not consider individual investment objectives or financial circumstances. Our objective is to deliver long-term, fundamental data-driven analysis. Be aware that our analysis might not incorporate the most recent, price-sensitive company announcements or qualitative information. GuruFocus holds no position in the stocks mentioned herein.