

LiveRamp Holdings Inc (RAMP, Financial) has recently shown a remarkable daily gain of 20% and an impressive three-month gain of 32.94%. Despite these gains, the company reports a Loss Per Share of $1.41. Investors are now faced with the critical question: is LiveRamp Holdings significantly undervalued? The following valuation analysis aims to shed light on this question, and we encourage readers to delve into the analysis for a comprehensive understanding of the company's market position.
Company Introduction
LiveRamp Holdings Inc (RAMP, Financial) operates a cloud-based software platform that is pivotal for businesses aiming to consolidate their customer data across various touchpoints. By merging first-party data with additional sources, LiveRamp Holdings enhances customer profiles for businesses and advertisers, while also aiding publishers in optimizing their ad inventory. With a subscription model contributing approximately 80% to its revenue, and a marketplace for data transactions making up the rest, LiveRamp Holdings has established a robust business model. When contrasting the company's stock price of $36 with the GF Value of $54.61, a potential undervaluation becomes apparent, setting the stage for an in-depth valuation analysis.

Summarize GF Value
The GF Value is a proprietary metric that represents the intrinsic value of a stock, combining historical trading multiples, a GuruFocus adjustment factor, and future business performance estimates. This value serves as a benchmark for what the stock's fair trading value should be. If a stock's price is significantly below the GF Value Line, as is the case with LiveRamp Holdings (RAMP, Financial), it suggests that the stock is undervalued and may offer better future returns. With a market cap of $2.40 billion, LiveRamp Holdings' current price suggests significant undervaluation, potentially leading to higher long-term returns than its business growth alone would indicate.

Financial Strength
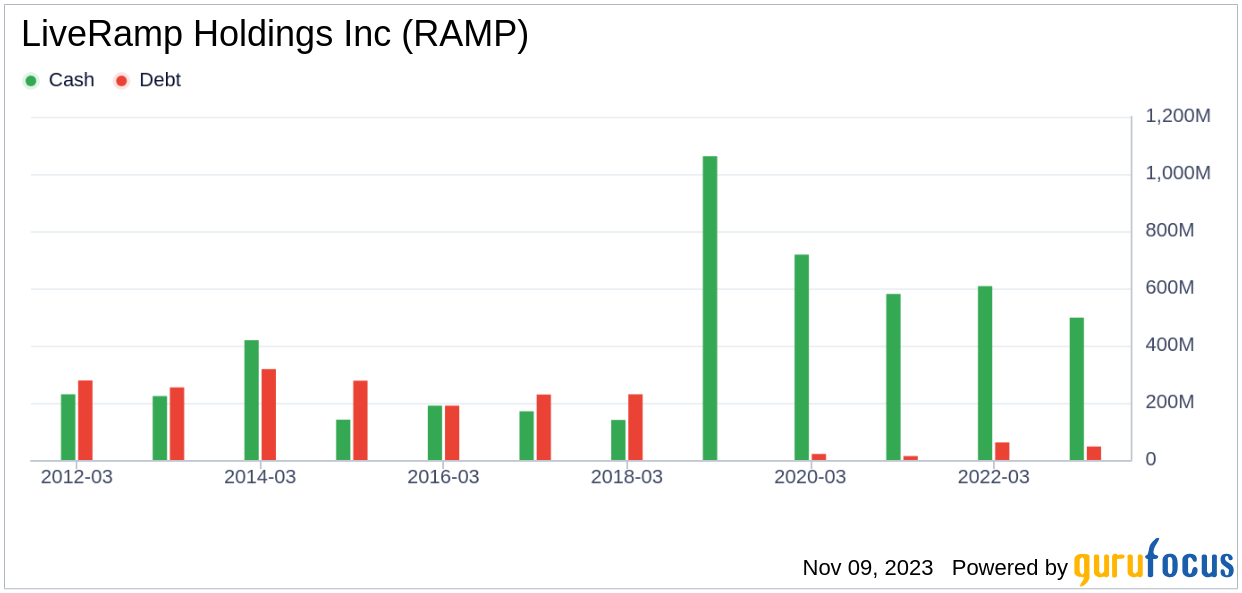
Investing in companies with strong financial strength reduces the risk of capital loss. LiveRamp Holdings boasts a cash-to-debt ratio of 10.71, outperforming 66.33% of its peers in the Software industry. This robust financial position, with a GuruFocus overall financial strength rating of 8 out of 10, implies that LiveRamp Holdings is financially resilient and well-equipped to navigate market fluctuations.
Profitability and Growth
Consistent profitability is a key indicator of a company's investment potential. LiveRamp Holdings has been profitable in 5 out of the past 10 years, with a revenue of $608.40 million and a Loss Per Share of $1.41 in the last twelve months. Despite an operating margin of -10.39%, which is lower than 68.28% of the companies in the Software industry, the company's profitability rank is a fair 5 out of 10. Moreover, LiveRamp Holdings' revenue growth rate of 17% over the past three years surpasses 68.99% of its industry counterparts, and its EBITDA growth rate of 20.2% ranks better than 67.57% of companies in the Software industry, indicating a strong growth trajectory.
ROIC vs. WACC
Comparing a company's Return on Invested Capital (ROIC) to its Weighted Average Cost of Capital (WACC) provides insight into profitability and value creation. LiveRamp Holdings' ROIC of -12.61 against a WACC of 8.77 suggests that the company is currently not generating sufficient returns on its investments. This comparison underscores the importance of assessing both profitability and financial health when considering an investment.

Conclusion
In summary, LiveRamp Holdings (RAMP, Financial) appears to be significantly undervalued in the market. The company demonstrates strong financial health and fair profitability, with growth rates that are commendable within the Software industry. For those interested in a deeper dive into LiveRamp Holdings' financials, the 30-Year Financials provide an extensive overview.
To discover high-quality companies that may offer above-average returns, be sure to explore the GuruFocus High Quality Low Capex Screener.
This article, generated by GuruFocus, is designed to provide general insights and is not tailored financial advice. Our commentary is rooted in historical data and analyst projections, utilizing an impartial methodology, and is not intended to serve as specific investment guidance. It does not formulate a recommendation to purchase or divest any stock and does not consider individual investment objectives or financial circumstances. Our objective is to deliver long-term, fundamental data-driven analysis. Be aware that our analysis might not incorporate the most recent, price-sensitive company announcements or qualitative information. GuruFocus holds no position in the stocks mentioned herein.