
BrightView Holdings, Inc. (NYSE: BV) (the “Company” or “BrightView”), the leading commercial landscaping services company in the United States, today reported unaudited results for the third quarter ended June 30, 2023.
This press release features multimedia. View the full release here: https://www.businesswire.com/news/home/20230802918551/en/
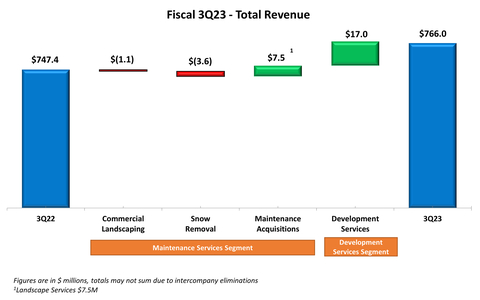
Fiscal 3Q23 - Total Revenue (Graphic: Business Wire)
“I am pleased to report solid third quarter results that reflect topline growth with meaningful margin expansion and continued improvement in our free cash flow,” said Jim Abrahamson, BrightView’s Interim President and Chief Executive Officer. “During the quarter we realized initial returns from Project Accelerate and expanded our strategic initiatives to include additional opportunities that can ultimately drive value creation and shareholder return. Across BrightView, there is a renewed focus on operational excellence and our strategy to achieve long-term success.”
Fiscal 2023 Results – Total BrightView
Total BrightView - Operating Highlights | ||||||||||||||||||||
Three Months Ended
| Nine Months Ended
| |||||||||||||||||||
($ in millions, except per share figures) | 2023 | 2022 | Change | 2023 | 2022 | Change | ||||||||||||||
Revenue | $ | 766.0 | $ | 747.4 | 2.5% | $ | 2,072.3 | $ | 2,051.2 | 1.0% | ||||||||||
Net Income (Loss) | $ | 16.8 | $ | 10.8 | 55.6% | $ | (24.1 | ) | $ | (1.3 | ) | NM | ||||||||
Net Income (Loss) Margin | 2.2 | % | 1.4 | % | 80 bps | (1.2 | %) | (0.1 | %) | (110) bps | ||||||||||
Adjusted EBITDA | $ | 101.8 | $ | 94.3 | 8.0% | $ | 197.1 | $ | 196.6 | 0.3% | ||||||||||
Adjusted EBITDA Margin | 13.3 | % | 12.6 | % | 70 bps | 9.5 | % | 9.6 | % | (10) bps | ||||||||||
Adjusted Net Income | $ | 41.4 | $ | 39.8 | 4.0% | $ | 33.5 | $ | 66.4 | (49.5%) | ||||||||||
Basic Income (Loss) per Share | $ | 0.18 | $ | 0.12 | 50.0% | $ | (0.26 | ) | $ | (0.01 | ) | NM | ||||||||
Adjusted Earnings per Share | $ | 0.44 | $ | 0.43 | 2.3% | $ | 0.36 | $ | 0.65 | (44.6%) | ||||||||||
Weighted average number of common shares outstanding | 93.5 | 93.2 | 0.3% | 93.4 | 102.7 | (9.1%) | ||||||||||||||
Adjusted EBITDA, Adjusted EBITDA Margin, Adjusted Net Income, Free Cash Flow and Adjusted Earnings per Share are non-GAAP measures. Refer to the “Non-GAAP Financial Measures” and “Reconciliation of GAAP to Non-GAAP Financial Measures” sections for more information. |
For the third quarter of fiscal 2023, total revenue increased 2.5% to $766.0 million driven by an increase of $17.0 million in Development Services, or 2.3% of the total increase year-over-year and an increase of $6.4 million in Maintenance Land growth, or 0.9% of the total increase year-over-year. These increases were partially offset by a $3.6 million decrease in snow removal services organic revenue year-over-year.
For the nine months ended June 30, 2023, total revenue increased 1.0% to $2,072.3 million driven by $55.9 million revenue contribution from acquired businesses, or 2.7% of the total increase year-over-year and an increase of $10.6 million in Maintenance Land organic growth, or 0.5% of the total increase year-over-year. These increases were partially offset by a decrease of $62.8 million in snow removal services organic revenues year-over-year associated with the lower snowfall in the period.
Fiscal 2023 Results – Segments
Maintenance Services - Operating Highlights | ||||||||||||||||||||
Three Months Ended
| Nine Months Ended
| |||||||||||||||||||
($ in millions) | 2023 | 2022 | Change | 2023 | 2022 | Change | ||||||||||||||
Landscape Maintenance | $ | 555.3 | $ | 548.9 | 1.2% | $ | 1,335.8 | $ | 1,296.3 | 3.0% | ||||||||||
Snow Removal | $ | 9.3 | $ | 12.9 | (27.9%) | $ | 209.9 | $ | 257.1 | (18.4%) | ||||||||||
Total Revenue | $ | 564.6 | $ | 561.8 | 0.5% | $ | 1,545.7 | $ | 1,553.4 | (0.5%) | ||||||||||
Adjusted EBITDA | $ | 94.0 | $ | 89.2 | 5.4% | $ | 196.2 | $ | 197.4 | (0.6%) | ||||||||||
Adjusted EBITDA Margin | 16.6 | % | 15.9 | % | 70 bps | 12.7 | % | 12.7 | % | 0 bps | ||||||||||
Capital Expenditures | $ | 9.3 | $ | 18.5 | (49.7%) | $ | 46.0 | $ | 67.4 | (31.8%) | ||||||||||
For the third quarter of fiscal 2023, revenue in the Maintenance Services Segment increased by $2.8 million, or 0.5%, from the 2022 period. The increase was driven by $7.5 million contribution from acquired businesses. Partially offsetting this was a decrease of $3.6 million in snow removal services and a decrease of $1.1 million in underlying commercial landscape services.
Adjusted EBITDA for the Maintenance Services Segment for the three months ended June 30, 2023 increased by $4.8 million to $94.0 million from $89.2 million in the 2022 period. Segment Adjusted EBITDA Margin increased 70 basis points, to 16.6%, in the three months ended June 30, 2023, from 15.9% in the 2022 period. The increases in Segment Adjusted EBITDA and Segment Adjusted EBITDA Margin were driven by disciplined management of labor costs in underlying commercial landscape services, coupled with lower fuel costs and savings from cost management initiatives, partially offset by the decrease in snow removal services revenue discussed above.
For the nine months ended June 30, 2023, Maintenance Services net service revenues decreased by $7.7 million, or 0.5%, from the 2022 period. The decrease was driven by a decrease of $47.2 million in snow removal services due to lower snowfall, net of $15.6 million from acquired businesses. Partially offsetting this was a $39.5 million increase in landscape services revenue consisting of a $28.9 million contribution from acquired businesses and an increase of $10.6 million, or 0.8%, in underlying commercial landscape services underpinned by contract services growth and to a lesser extent ancillary services growth.
Adjusted EBITDA for the Maintenance Services Segment for the nine months ended June 30, 2023 decreased by $1.2 million to $196.2 million from $197.4 million in the 2022 period. Segment Adjusted EBITDA Margin was 12.7% in each of the nine months ended June 30, 2023 and 2022. The decrease in Segment Adjusted EBITDA was driven by the decrease in snow removal services revenues described above, partially offset by increases in revenues from underlying commercial landscape services and acquisitions discussed above.
Development Services - Operating Highlights | ||||||||||||||||||||
Three Months Ended
| Nine Months Ended
| |||||||||||||||||||
($ in millions) | 2023 | 2022 | Change | 2023 | 2022 | Change | ||||||||||||||
Revenue | $ | 203.4 | $ | 186.4 | 9.1% | $ | 533.3 | $ | 500.8 | 6.5% | ||||||||||
Adjusted EBITDA | $ | 24.1 | $ | 20.9 | 15.3% | $ | 53.6 | $ | 48.2 | 11.2% | ||||||||||
Adjusted EBITDA Margin | 11.8 | % | 11.2 | % | 60 bps | 10.1 | % | 9.6 | % | 50 bps | ||||||||||
Capital Expenditures | $ | 2.5 | $ | 2.8 | (10.7%) | $ | 7.2 | $ | 10.9 | (33.9%) | ||||||||||
For the third quarter of fiscal 2023, revenue in the Development Services Segment increased by $17.0 million, or 9.1%, compared to the prior year. The increase was principally driven by an increase in Development Services project volumes of $17.0 million.
Adjusted EBITDA for the Development Services Segment for the three months ended June 30, 2023 increased $3.2 million, to $24.1 million, compared to the 2022 period. Segment Adjusted EBITDA Margin increased 60 basis points, to 11.8% for the quarter from 11.2% in the prior year. The increases in Segment Adjusted EBITDA and Segment Adjusted EBITDA Margin were primarily driven by the increase in project volumes described above, partially offset by increased labor and materials costs attributable to the mix of projects relative to the prior year.
For the nine months ended June 30, 2023, revenue in the Development Services Segment increased $32.5 million, or 6.5%, compared to the 2022 period. The increase was principally driven by an increase of $21.1 million due to additional project volumes combined with an $11.4 million revenue contribution from acquired businesses.
Adjusted EBITDA for the Development Services Segment for the nine months ended June 30, 2023 increased $5.4 million, to $53.6 million in the prior year. Segment Adjusted EBITDA Margin increased 50 basis points, to 10.1% for the period from 9.6% in the 2022 period. Segment Adjusted EBITDA and Segment Adjusted EBITDA Margin increased principally due to the increase in revenues described above coupled with disciplined management of materials costs.
Total BrightView Cash Flow Metrics | ||||||||||
Nine Months Ended
| ||||||||||
($ in millions) | 2023 | 2022 | Change | |||||||
Net Cash Provided by Operating Activities | $ | 89.3 | $ | 65.7 | 35.9% | |||||
Free Cash Flow | $ | 38.2 | $ | (17.0 | ) | (324.7%) | ||||
Capital Expenditures | $ | 57.9 | $ | 88.1 | (34.3%) | |||||
Net cash provided by operating activities for the nine months ended June 30, 2023 increased $23.6 million, to $89.3 million, from $65.7 million in the 2022 period. This increase was due to a decrease in cash used by accounts payable and other operating liabilities and an increase in cash provided by other operating assets. This was partially offset by an increase in cash used by accounts receivable and a decrease in the cash provided by unbilled and deferred revenue.
Free Cash Flow increased $55.2 million to an inflow of $38.2 million for the nine months ended June 30, 2023 from an outflow of $17.0 million in the prior year. The increase in Free Cash Flow was due to an increase in net cash provided by operating activities, as described above, coupled with a decrease in cash used for capital expenditures, as described below.
For the nine months ended June 30, 2023, capital expenditures were $57.9 million, compared with $88.1 million in the prior year. The Company also generated proceeds from the sale of property and equipment of $6.8 million and $5.4 million during the nine months ended June 30, 2023 and 2022, respectively. Net of the proceeds from the sale of property and equipment, net capital expenditures represented 2.5% of revenue in the nine months ended June 30, 2023, a decrease of 150 bps compared to 4.0% for the nine months ended June 30, 2022.
Total BrightView Balance Sheet Metrics | ||||||||||||
($ in millions) | June 30,
| March 31,
| September 30,
| |||||||||
Long-term debt, net | $ | 1,336.2 | $ | 1,344.9 | $ | 1,330.7 | ||||||
Total Financial Debt1 | $ | 1,404.3 | $ | 1,409.3 | $ | 1,395.0 | ||||||
Minus: | ||||||||||||
Total Cash & Equivalents | 9.6 | 11.0 | 20.1 | |||||||||
Total Net Financial Debt2 | $ | 1,394.7 | $ | 1,398.3 | $ | 1,374.9 | ||||||
Total Net Financial Debt to Adjusted EBITDA ratio3 | 4.8x | 5.0x | 4.8x | |||||||||
1Total Financial Debt includes total long-term debt, net of original issue discount, and finance lease obligations | ||||||||||||
2Total Net Financial Debt equals Total Financial Debt minus Total Cash & Equivalents | ||||||||||||
3Total Net Financial Debt to Adjusted EBITDA ratio equals Total Net Financial Debt divided by the trailing twelve month Adjusted EBITDA. | ||||||||||||
As of June 30, 2023, the Company’s Total Net Financial Debt was $1,394.7 million, a decrease of $3.6 million compared to $1,398.3 as of March 31, 2023. The Company’s Total Net Financial Debt to Adjusted EBITDA ratio was 4.8x and 5.0x as of June 30, 2023 and March 31, 2023, respectively.
Conference Call Information
A conference call to discuss the third quarter fiscal 2023 financial results is scheduled for August 3, 2023, at 10 a.m. ET. The U.S. toll free dial-in for the conference call is (833) 470-1428 and the international dial-in is +1 (404) 975-4839. The Conference ID is 406230. A live audio webcast of the conference call will be available on the Company’s investor website https://investor.brightview.com, where presentation materials will be posted prior to the call.
A replay of the call will be available until 11:59 p.m. ET on August 10, 2023. To access the recording, dial (866) 813-9403 (Conference ID 986902).
About BrightView
BrightView (NYSE: BV), the nation’s largest commercial landscaper, proudly designs, creates, and maintains some of the best landscapes on Earth and provides the most efficient and comprehensive snow and ice removal services. With a dependable service commitment, BrightView brings brilliant landscapes to life at premier properties across the United States, including business parks and corporate offices, homeowners' associations, healthcare facilities, educational institutions, retail centers, resorts and theme parks, municipalities, golf courses, and sports venues. BrightView also serves as the Official Field Consultant to Major League Baseball. Through industry-leading best practices and sustainable solutions, BrightView is invested in taking care of our team members, engaging our clients, inspiring our communities, and preserving our planet. Visit www.BrightView.com and connect with us on Twitter, Facebook, and LinkedIn.
Forward Looking Statements
This press release contains forward looking statements within the meaning of the Private Securities Litigation Reform Act of 1995, Section 27A of the Securities Act of 1933, as amended, and Section 21E of the Securities Exchange Act of 1934, as amended, that involve substantial risks and uncertainties. All statements, other than statements of historical facts, contained in this presentation, including statements relating to our fourth quarter and full year fiscal 2023 guidance and other statements related to our goals, beliefs, business outlook, business trends, expectations regarding our industry, strategy, future events, future operations, future liquidity and financial position, future revenues, projected costs, prospects, plans and objectives of management, are forward-looking statements. Words such as “outlook,” “guidance,” “projects,” “continues,” “believes,” “expects,” “may,” “will,” “should,” “seeks,” “intends,” “plans,” “estimates,” or “anticipates,” or the negative variations of these words or similar expressions are intended to identify forward-looking statements, although not all forward-looking statements contain these identifying words. By their nature, forward-looking statements: speak only as of the date they are made; are not statements of historical fact or guarantees of future performance, and are based upon our current expectations, beliefs, estimates and projections, and various assumptions, many of which are subject to risks, uncertainties, assumptions, changes in circumstances or other factors outside of the Company’s control that are difficult to predict or quantify. Our expectations, beliefs, and projections are expressed in good faith and we believe there is a reasonable basis for them. However, there can be no assurance that management’s expectations, beliefs and projections will result or be achieved and actual results may vary materially from what is expressed in or indicated by the forward-looking statements. Factors that could cause actual results to differ materially from those projected include, but are not limited to: general business, economic and financial conditions; higher operational and supply costs and expenses due to inflation, and our inability to pass higher costs and expenses onto our customers through price increases; competitive industry pressures; the failure to retain current customers, renew existing customer contracts and obtain new customer contracts; the failure to enter into profitable contracts, or maintaining customer contracts that are unprofitable; a determination by customers to reduce their outsourcing or use of preferred vendors; the dispersed nature of our operating structure; our ability to implement our business strategies and achieve our growth objectives; the possibility that the anticipated benefits from our business acquisitions will not be realized in full or at all or may take longer to realize than expected; the possibility that costs or difficulties related to the integration of acquired businesses’ operations will be greater than expected and the possibility that integration efforts will disrupt our business and strain management time and resources; the seasonal nature of our landscape maintenance services; our dependence on weather conditions and the impact of severe weather and climate change on our business; increases in prices for raw materials, labor and fuel caused by rising inflation or otherwise; disruptions in our supply chain and changes in our ability to source adequate supplies and materials in a timely manner; the duration and extent of the novel coronavirus (COVID-19) pandemic and its resurgence, and the impact of federal, state and local governmental actions and customer behavior in response to the pandemic, including possible additional or reinstated restrictions as a result of a resurgence of the pandemic; any failure to accurately estimate the overall risk, requirements, or costs when we bid on or negotiate contracts that are ultimately awarded to us; the conditions and periodic fluctuations of real estate markets, including residential and commercial construction; our ability to retain or hire our executive management and other key personnel; our ability to attract and retain field and hourly employees, trained workers and third-party contractors and re-employ seasonal workers; any failure to properly verify employment eligibility of our employees; subcontractors taking actions that harm our business; our recognition of future impairment charges; laws and governmental regulations, including those relating to employees, wage and hour, immigration, human health and safety and transportation; environmental, health and safety laws and regulations, including regulatory costs, claims and litigation related to the use of chemicals and pesticides by employees and related third-party claims; our ability to pursue and achieve our environmental, social and corporate governance (ESG) focus area goals and targets and the possibility that complying with ESG standards and meeting our goals may be significantly more costly than anticipated; the distraction and impact caused by litigation, of adverse litigation judgments and settlements resulting from legal proceedings; increase in on-job accidents involving employees; any failure, inadequacy, interruption, security failure or breach of our information technology systems; our ability to adequately protect our intellectual property; restrictions imposed by our debt agreements that limit our flexibility in operating our business; our ability to gen