
AB InBev (Brussel:ABI) (BMV:ANB) (JSE:ANH, Financial) (NYSE:BUD, Financial):
This press release features multimedia. View the full release here: https://www.businesswire.com/news/home/20230802588545/en/
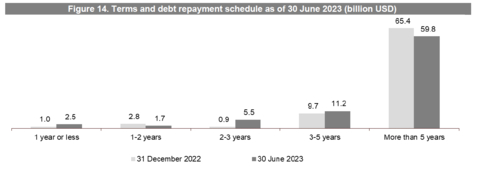
Figure 14. Terms and debt repayment schedule as of 30 June 2023 (billion USD) (Graphic: Business Wire)
Regulated information1
“Our business delivered another quarter ofprofitable growth. Revenue increased by 7.2% with an EBITDA increase of 5.0%. We continue to invest in our strategic priorities for the long-term.” – Michel Doukeris, CEO, AB InBev
Total Revenue +7.2% Revenue increased by 7.2% in 2Q23 with revenue per hl growth of 9.0% and by 10.0% in HY23 with revenue per hl growth of 10.6%. 18.4%increase in combined revenues of our global brands, Budweiser, Stella Artois and Corona, outside of their respective home markets in 2Q23, and 16.9% in HY23. Approximately 64%of our revenue through B2B digital platforms with the monthly active user base of BEES reaching 3.3 million users. Over 115 million USDof revenue generated by our digital direct-to-consumer ecosystem. Total Volume -1.4% In 2Q23, total volumes declined by 1.4%, with own beer volumes down by 1.8% and non-beer volumes up by 0.5%. In HY23, total volumes declined by 0.3% with own beer volumes down by 0.8% and non-beer volumes up by 2.1%. Normalized EBITDA +5.0% In 2Q23, normalized EBITDA increased by 5.0% to 4 909 million USD with a normalized EBITDA margin contraction of 69 bps to 32.5%.In HY23, normalized EBITDA increased by 9.1% to 9 668 million USD and normalized EBITDA margin contracted by 29 bps to 33.0%. Normalized EBITDA figures of HY22 include an impact of 201 million USD from tax credits in Brazil. | Underlying Profit 1 452 million USD Underlying profit (profit attributable to equity holders of AB InBev excluding non-underlying items and the impact of hyperinflation) was 1 452 million USD in 2Q23 compared to 1 468 million USD in 2Q22 and was 2 762 million USD in HY23 compared to 2 672 million USD in HY22. Underlying EPS 0.72 USD Underlying EPS was 0.72 USD in 2Q23, a decrease from 0.73 USD in 2Q22 and was 1.37 USD in HY23, an increase from 1.33 USD in HY22. Net Debt to EBITDA 3.70x Net debt to normalized EBITDA ratio was 3.70x at 30 June 2023 compared to 3.86x at 30 June 2022 and 3.51x at 31 December 2022. |
The 2023 Half Year Financial Report is available on our website at www.ab-inbev.com. |
1The enclosed information constitutes regulated information as defined in the Belgian Royal Decree of 14 November 2007 regarding the duties of issuers of financial instruments which have been admitted for trading on a regulated market. For important disclaimers and notes on the basis of preparation, please refer to page 15. |
Management comments
Continued global momentum, partially offset by US performance, delivered high-single digit revenue growth
We delivered a top-line increase of 7.2%, with revenue growth in more than 85% of our markets, driven by a revenue per hl increase of 9.0% as a result of pricing actions, ongoing premiumization and other revenue management initiatives. Volumes declined by 1.4%, as growth in the majority of our markets was offset by performance in the US. EBITDA increased by 5.0% with margin compression of 69bps, driven by anticipated commodity cost headwinds and increased sales and marketing investments. Underlying EPS was 0.72 USD.
Progressing our strategic priorities
We continue to execute on and invest in three key strategic pillars to deliver consistent growth and long-term value creation.
Lead and grow the category:
This quarter we delivered volume growth in the majority of our markets and revenue growth in more than 85%.
Digitize and monetize our ecosystem:
BEES captured approximately 9.2 billion USD of gross merchandise value (GMV), a 30% increase versus 2Q22 with 64% of our revenue through B2B digital channels. BEES Marketplace is live in 15 markets and generated an annualized GMV of approximately 1.3 billion USD with 63% of BEES customers now also Marketplace buyers.
Optimize our business:
In HY23, disciplined overhead management and efficient resource allocation enabled us to invest approximately 2.1 billion USD in capex and 3.5 billion USD in sales and marketing to drive the organic growth of our business. We continue to focus on deleveraging with net debt to EBITDA reaching 3.70x versus 3.86x as of 30 June 2022.
Lead and grow the category
In HY23, we invested approximately 3.5 billion USD in sales and marketing, a 12.8% increase versus HY22, driving an increase of our portfolio brand power in approximately 60% of our key markets. We are executing on our five proven and scalable levers to drive category expansion:
- Inclusive Category: In 2Q23, the percentage of consumers purchasing our portfolio of brands increased across key markets in Latin America and Africa, according to our estimates. This increase in participation was led by female and lower income consumer groups, driven by continued brand and pack innovation.
- Core Superiority:In 2Q23, our mainstream portfolio delivered a mid-single digit revenue increase as double-digit growth in South Africa and Colombia was partially offset by the revenue decline of Bud Light in the US. Our mainstream brands gained or maintained share of segment in two thirds of our key markets, according to our estimates.
- Occasions Development: Our global no-alcohol beer portfolio delivered approximately 30% revenue growth this quarter, with our performance driven by Budweiser Zero in Brazil and growth of Corona Cero in Canada and Europe. Leveraging our digital direct-to-consumer products we are investing in and developing new consumption occasions. For example, in Brazil, Zé Delivery enabled the launch of Corona Sunset Hours, an everyday activation encouraging consumers to disconnect from work and reconnect with friends in the early evening.
- Premiumization:Our above core beer portfoliogrew revenue by more than 10% in 2Q23, led by our global brands and double-digit growth of Modelo in Mexico and Spaten in Brazil. Our global brands grew revenue by 18.4% outside of their home markets, led by Corona, which was recently recognized by Kantar BrandZ as the #1 fastest growing global beer brand by value, which grew by 23.7%. Budweiser delivered a revenue increase of 16.9%, with broad-based growth in 25 markets, and Stella Artois grew by 14.5%.
- Beyond Beer:Our global Beyond Beer business contributed over 385 million USD of revenue in the quarter and grew by mid-single digits as growth globally was partially offset by a soft malt-based seltzer industry in the US. Global growth was primarily driven by the expansion of Brutal Fruit in Africa and the Vicky portfolio in Mexico.
Digitize and monetize our ecosystem
- Digitizing our relationships with more than 6 million customers globally: As of 30 June 2023, BEES is live in 23 markets with approximately 64% of our 2Q23 revenues captured through B2B digital platforms. In 2Q23,BEES had 3.3 million monthly active users and captured approximately 9.2 billion USD in gross merchandise value (GMV), growth of 15% and 30% versus 2Q22 respectively. BEES Marketplace is live in 15 markets with 63% of BEES customers also marketplace buyers. Marketplace captured approximately 340 million USD in GMV from sales of third-party products this quarter, growth of 41% versus 2Q22.
- Leading the way in DTC solutions: Our omnichannel direct-to-consumer (DTC) ecosystem of digital and physical products generated revenue of more than 385 million USD in 2Q23. Our digital DTC products, Zé Delivery, TaDa and PerfectDraft are available in 20 markets, generated 16.5 million ecommerce orders and delivered over 115 million USD in revenue this quarter, representing 18% growth versus 2Q22.
Optimize our business
In HY23, disciplined overhead management and efficient allocation of resources across our operations enabled us to invest approximately 2.1 billion USD in capex and 3.5 billion USD in sales and marketing to drive the organic growth of our business, while managing the continued elevated cost environment. Our net debt to EBITDA ratio reached 3.70x versus 3.86x as of 30 June 2022, an increase versus 3.51x as of 31 December 2022 due to the seasonality of our cashflow generation. Underlying EPS was 0.72 USD, a decrease of 0.01 USD per share versus 2Q22, cycling a 0.04 USD per share net benefit from tax credits in Brazil year-over-year.
Advancing our sustainability priorities
We continued to innovate and make progress towards our 2025 Sustainability Goals through key local initiatives with the potential to scale globally. For Climate Action, we invested in a biomass processor in our Jupille brewery in Belgium to produce thermal energy from malt husks, which is expected to reduce our gas consumption by more than 15% and lower our carbon emissions. In Sustainable Agriculture, to strengthen local supply chains we provided technical and financial training to over 900 smallholder barley farmers in Uganda. In Water Stewardship, we installed new vacuum pump technology in breweries across several markets to reduce water usage in bottle fillers by approximately 50%. For Circular Packaging, our business in Brazil launched a nationwide returnable bottle campaign to help increase the use of returnable packaging by promoting affordability and sustainability.
Creating a future with more cheers
In HY23, we delivered 10.0% revenue growth and 9.1% EBITDA growth while continuing to invest for the long-term in our brands, facilities and digital transformation. We remain focused on brewing high quality beer, providing best-in-class service to our customers, generating value for our stakeholders and delivering on our purpose to create a future with more cheers.
2023 Outlook
(i) | Overall Performance: We expect our EBITDA to grow in line with our medium-term outlook of between 4-8% and our revenue to grow ahead of EBITDA from a healthy combination of volume and price. The outlook for FY23 reflects our current assessment of inflation and other macroeconomic conditions. | |
(ii) | Net Finance Costs: Net pension interest expenses and accretion expenses are expected to be in the range of 200 to 230 million USD per quarter, depending on currency and interest rate fluctuations. We expect the average gross debt coupon in FY23 to be approximately 4%. | |
(iii) | Effective Tax Rates (ETR): We expect the normalized ETR in FY23 to be in the range of 27% to 29%. The ETR outlook does not consider the impact of potential future changes in legislation. | |
(iv) | Net Capital Expenditure: We expect net capital expenditure of between 4.5 and 5.0 billion USD in FY23. |
Figure 1. Consolidated performance (million USD) | |||
2Q22 | 2Q23 | Organic | |
growth | |||
Total Volumes (thousand hls) | 149 729 | 147 583 | -1.4% |
AB InBev own beer | 131 107 | 128 750 | -1.8% |
Non-beer volumes | 17 544 | 17 636 | 0.5% |
Third party products | 1 079 | 1 197 | 12.9% |
Revenue | 14 793 | 15 120 | 7.2% |
Gross profit | 7 997 | 8 101 | 5.5% |
Gross margin | 54.1% | 53.6% | -86 bps |
Normalized EBITDA | 5 096 | 4 909 | 5.0% |
Normalized EBITDA margin | 34.5% | 32.5% | -69 bps |
Normalized EBIT | 3 811 | 3 569 | 2.2% |
Normalized EBIT margin | 25.8% | 23.6% | -114 bps |
Profit attributable to equity holders of AB InBev | 1 597 | 339 | |
Underlying profit attributable to equity holders of AB InBev | 1 468 | 1 452 | |
Earnings per share (USD) | 0.79 | 0.17 | |
Underlying earnings per share (USD) | 0.73 | 0.72 |
HY22 | HY23 | Organic | |
growth | |||
Total Volumes (thousand hls) | 289 074 | 288 131 | -0.3% |
AB InBev own beer | 251 692 | 249 810 | -0.8% |
Non-beer volumes | 35 488 | 36 223 | 2.1% |
Third party products | 1 894 | 2 098 | 12.5% |
Revenue | 28 027 | 29 333 | 10.0% |
Gross profit | 15 243 | 15 796 | 8.8% |
Gross margin | 54.4% | 53.9% | -60 bps |
Normalized EBITDA | 9 583 | 9 668 | 9.1% |
Normalized EBITDA margin | 34.2% | 33.0% | -29 bps |
Normalized EBIT | 7 105 | 7 072 | 8.3% |
Normalized EBIT margin | 25.4% | 24.1% | -39 bps |
Profit attributable to equity holders of AB InBev | 1 692 | 1 977 | |
Underlying profit attributable to equity holders of AB InBev | 2 672 | 2 762 | |
Earnings per share (USD) | 0.84 | 0.98 | |
Underlying earnings per share (USD) | 1.33 | 1.37 |
Figure 2. Volumes (thousand hls) | ||||||
2Q22 | Scope | Organic | 2Q23 | Organic growth | ||
growth | Total Volume | Own beer volume | ||||
North America | 27 361 | 35 | -3 854 | 23 542 | -14.1% | -14.5% |
Middle Americas | 37 775 | - | 118 | 37 893 | 0.3% | -1.0% |
South America | 36 421 | 7 | - 691 | 35 737 | -1.9% | -1.5% |
EMEA | 22 838 | 60 | -14 | 22 884 | -0.1% | -0.3% |
Asia Pacific | 25 097 | - | 2 378 | 27 475 | 9.5% | 9.3% |
Global Export and Holding Companies | 238 | -102 | -84 | 51 | -62.3% | - |
AB InBev Worldwide | 149 729 | - | -2 147 | 147 583 | -1.4% | -1.8% |
HY22 | Scope | Organic | HY23 | Organic growth | ||
growth | Total Volume | Own beer volume | ||||
North America | 51 448 | 51 | -4 104 | 47 395 | -8.0% | -8.2% |
Middle Americas | 72 024 | - | 141 | 72 164 | 0.2% | -0.8% |
South America | 76 815 | - | - 791 | 76 023 | -1.0% | -1.7% |
EMEA | 42 962 | 104 | - 224 | 42 842 | -0.5% | -0.9% |
Asia Pacific | 45 385 | - | 4 204 | 49 589 | 9.3% | 9.1% |
Global Export and Holding Companies | 440 | -155 | -168 | 117 | -58.9% | - |
AB InBev Worldwide | 289 074 | - | - 943 | 288 131 | -0.3% | -0.8% |
Key Market Performances
United States: Revenue declined by 10.5% impacted by volume performance
- Operating performance:
- 2Q23: Revenue declined by 10.5% with revenue per hl growing by 5.2% driven by revenue management initiatives. Sales-to-wholesalers (STWs) were down by 15.0%. Sales-to-retailers (STRs) declined by 14.0%, underperforming the industry, primarily due to the volume decline of Bud Light. EBITDA declined by 28.2%, with approximately two thirds of this decrease attributable to market share performance and the remainder from productivity loss, increased sales and marketing investments and support measures for our wholesaler partners.
- HY23: Revenue declined by 3.6% with revenue per hl growth of 5.4%. Our STWs declined by 8.6% and STRs were down by 9.2%. EBITDA declined by 14.8%.
- Commercial highlights: The beer industry continued to demonstrate resilience in 2Q23, delivering revenue growth of 2.3% while volumes declined by 2.5%, according to Circana. Our total beer industry share declined this quarter but has been stable since the last week of April through the end of June. Since April, we actively engaged with over 170 000 consumers across the country through a third-party research firm and the data shows that most consumers surveyed are favorable towards the Bud Light brand and approximately 80% are favorable or neutral. As part of our long-term plan, we increased investments in our key brands, invested in measures to support our wholesalers and continued key initiatives such as partnerships with NFL, NBA, Folds of Honor and Farm Rescue.
Mexico: Double-digit top- and bottom-line growth with continued market share gain
- Operating performance:
- 2Q23: Revenue grew by low-teens with revenue per hl growth of low-teens driven by pricing actions and other revenue management initiatives. Volumes declined by low-single digits, outperforming the industry which was impacted by an earlier Easter. EBITDA grew by mid-teens with margin expansion of over 175bps.
- HY23: Revenue grew by low-teens with revenue per hl growing by low-teens and volumes flat. EBITDA grew by mid-teens.
- Commercial highlights: Our performance this quarter was driven by ongoing portfolio development and digital transformation. Our above core portfolio continued to outperform, growing revenue by mid-teens, led by the strong performance of Modelo, Michelob Ultra and Pacifico. We continued to progress our digital and physical DTC initiatives this quarter with our digital DTC platform, TaDa, now operating in over 60 major cities and fulfilling on average over 300 000 orders per month and the opening of a further 150 Modelorama stores.
Colombia: High-single digit top- and double-digit bottom-line growth
- Operating performance:
- 2Q23: Revenue grew by high-single digits with high-single digit revenue per hl growth, driven by pricing actions and other revenue management initiatives. Volumes grew by low-single digits, continuing to gain share of total alcohol in an improving consumer environment. EBITDA grew by low-twenties, driven by top-line growth and supported by cycling a loss from the disposal of non-core assets in 2Q22.
HY23: Revenue grew by high-single digits with revenue per hl growth of high-single digits. Volumes declined by low-single digits. EBITDA grew by high-single digits.
- 2Q23: Revenue grew by high-single digits with high-single digit revenue per hl growth, driven by pricing actions and other revenue management initiatives. Volumes grew by low-single digits, continuing to gain share of total alcohol in an improving consumer environment. EBITDA grew by low-twenties, driven by top-line growth and supported by cycling a loss from the disposal of non-core assets in 2Q22.
- Commercial highlights: Our leading mainstream portfolio drove our performance this quarter, with a particularly strong performance from Poker which grew volumes by mid-teens.
Brazil: High-single digit top-line and double-digit bottom-line growth with margin expansion
- Operating performance:
- 2Q23: Revenue grew by 9.4% with revenue per hl growth of 12.2% driven by revenue management initiatives and continued premiumization. Beer volumes declined by 2.6%, underperforming the industry according to our estimates, as we cycled a strong performance in 2Q22 which was supported by post-COVID recovery. Non-beer volumes declined by 2.2% resulting in a total volume decrease of 2.5%. EBITDA increased by 29.0% with margin expansion of approximately 400bps.
- HY23: Total volumes were flat with beer volumes down 0.9% and non-beer volumes up 2.5%. Both revenue and revenue per hl increased by 12.4%. EBITDA grew by 27.7%.
- Commercial highlights: Our premium and super premium brands continued to outperform this quarter, delivering volume growth in the mid-thirties, led by Original, Spaten and Corona. BEES Marketplace continued to expand, reaching over 700 thousand customers, a 29% increase versus 2Q22, and growing GMV by 64%. Our digital DTC platform, Zé Delivery, reached 4.6 million monthly active users this quarter, a 12% increase versus 2Q22, and increased GMV by 12%.
Europe: High single digit top- and bottom-line growth
- Operating performance:
- 2Q23: Revenue grew by high-single digits with mid-teens revenue per hl growth, driven by pricing actions and the continued momentum of our premium and super premium brands. Volumes declined by mid-single digits, outperforming a soft industry in the majority of our key markets according to our estimates. EBITDA grew by high-single digits.
- HY23: Revenue grew by double-digits, driven by mid-teens revenue per hl growth. Volumes declined by low-single digits. EBITDA increased by high-single digits.
- Commercial highlights: We continue to drive premiumization across Europe. Our premium and super premium brands delivered double-digit revenue growth this quarter, led by Corona and Budweiser.
South Africa: Double digit top-line growth with continued market share gain
- Operating performance:
- 2Q23: Revenue grew by high-teens, with revenue per hl growth of more than 10%, driven by pricing actions and other revenue management initiatives. Our volumes grew by high-single digits, ahead of the industry according to our estimates, driven by strong consumer demand for our brands and supported by a favorable comparable due to production constraints in 2Q22. EBITDA was flattish as top-line growth was offset primarily by anticipated commodity cost headwinds.
- HY23: Revenue grew by low-teens with high-single digit revenue per hl growth and a mid-single digit increase in volume. EBITDA declined by low-single digits.
- Commercial highlights: We continue to see strong consumer demand for our portfolio, gaining share of beer and total alcohol according to our estimates. Carling Black Label, the #1 beer brand in the country, led our performance this quarter with high-teens volume growth and our global brands grew volumes by more than 50%, driven by Corona.
China: Double-digit top- and bottom-line growth
- Operating performance:
- 2Q23: Volumes grew by 11.0%, outperforming the industry according to our estimates. Revenue per hl increased by 7.6%, driven by on-premise recovery and continued premiumization, resulting in revenue growth of 19.4%. EBITDA grew by 21.8%.
- HY23: Volumes grew by 9.4% and revenue per hl by 5.4%, leading to a total revenue increase of 15.3%. EBITDA grew by 17.4%.
- Commercial highlights: We delivered volume growth across all segments of our portfolio this quarter, led by mid-twenties volume growth in both our premium and super premium portfolios. The roll out and adoption of the BEES platform continued, with BEES now present in over 220 cities and over 45% of our revenue through digital channels in June.
Highlights from our other markets
- Canada: Revenue increased by low-single digits this quarter with revenue per hl growth of high-single digits, driven by revenue management initiatives and premiumization. Volumes declined by mid-single digits, underperforming a soft industry.
- Peru: Revenue grew by high-single digits this quarter with revenue per hl growing by low-teens, driven primarily by revenue management initiatives. Volumes declined by low-single digits, outperforming a soft industry and gaining share of total alcohol.
- Ecuador: Revenue grew by high-single digits in 2Q23 with volumes increasing by low-single digits, supported by continued share of total alcohol gains. Our above core brands continued to lead our growth, delivering a double-digit revenue increase.
- Argentina: Revenue increased by high-single digits on a reported USD basis and by over 100% on an organic basis in 2Q23, driven by revenue management initiatives in a highly inflationary environment. Beer volumes grew by low-single digits with total volumes declining by low-single digits.
- Africa excluding South Africa: In Nigeria, our top-line grew by mid-teens this quarter with total volumes declining by high-single digits, driven by a soft industry which was impacted by the continued challenging operating environment. In our other markets, we grew volumes in aggregate by high-single digits in 2Q23, driven primarily by Tanzania, Ghana and Uganda.
- South Korea: Total revenue declined by high-single digits, driven by a low-single digit volume decline as we cycled post-COVID recovery in 2Q22.Revenue per hl decreased by mid-single digits, driven primarily by an excise tax increase.
Consolidated Income Statement
Figure 3. Consolidated income statement (million USD) | |||
2Q22 | 2Q23 | Organic | |
growth | |||
Revenue | 14 793 | 15 120 | 7.2% |
Cost of sales | -6 796 | -7 019 | -9.2% |
Gross profit | 7 997 | 8 101 | 5.5% |
SG&A | -4 500 | -4 707 | -9.4% |
Other operating income/(expenses) | 314 | 175 | 47.8% |
Normalized profit from operations (normalized EBIT) | 3 811 | 3 569 | 2.2% |
Non-underlying items above EBIT (incl. impairment losses) |